DIRECTV 2011 Annual Report Download - page 116
Download and view the complete annual report
Please find page 116 of the 2011 DIRECTV annual report below. You can navigate through the pages in the report by either clicking on the pages listed below, or by using the keyword search tool below to find specific information within the annual report.-
 1
1 -
2
-
3
-
4
-
5
-
6
-
7
-
8
-
9
-
10
-
11
-
12
-
13
-
14
-
15
-
16
-
17
-
18
-
19
-
20
-
21
-
22
-
23
-
24
-
25
-
26
-
27
-
28
-
29
-
30
-
31
-
32
-
33
-
34
-
35
-
36
-
37
-
38
-
39
-
40
-
41
-
42
-
43
-
44
-
45
-
46
-
47
-
48
-
49
-
50
-
51
-
52
-
53
-
54
-
55
-
56
-
57
-
58
-
59
-
60
-
61
-
62
-
63
-
64
-
65
-
66
-
67
-
68
-
69
-
70
-
71
-
72
-
73
-
74
-
75
-
76
-
77
-
78
-
79
-
80
-
81
-
82
-
83
-
84
-
85
-
86
-
87
-
88
-
89
-
90
-
91
-
92
-
93
-
94
-
95
-
96
-
97
-
98
-
99
-
100
-
101
-
102
-
103
-
104
-
105
-
 106
106 -
 107
107 -
 108
108 -
 109
109 -
 110
110 -
 111
111 -
 112
112 -
 113
113 -
 114
114 -
 115
115 -
 116
116 -
 117
117 -
 118
118 -
 119
119 -
 120
120 -
 121
121 -
 122
122 -
 123
123 -
 124
124 -
 125
125 -
 126
126 -
127
-
128
-
129
-
130
-
131
-
132
-
133
-
134
-
135
-
136
-
137
-
138
-
139
-
140
-
141
-
142
-
143
-
144
-
145
-
146
-
147
-
148
-
149
-
150
-
151
-
152
 |
 |

DIRECTV
NOTES TO THE CONSOLIDATED FINANCIAL STATEMENTS—(continued)
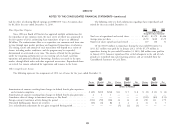
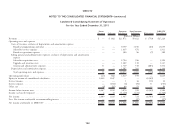
Black-Scholes valuation model, along with the assumptions used in the fair value The following table presents the estimated weighted average fair value as of
calculations. Expected stock volatility is based primarily on the historical volatility December 31, 2011, 2010 and 2009 for the equity instruments issued to persons
of our common stock. The risk-free rate for periods within the contractual lives of other than employees and directors carried as a liability using the Black-Scholes
the options are based on the U.S. Treasury yield curve in effect at the time of valuation model along with the assumptions used in the fair value calculations.
grant. The expected option life is based on historical exercise behavior, the Expected stock volatility is based primarily on the historical volatility of our
contractual life of the awards, and other factors. common stock. The risk-free rate for periods within the contractual lives of the
options are based on the U.S. Treasury yield curve in effect at the time of grant.
November 19, 2009 The expected option life is based on the contractual life of the awards.
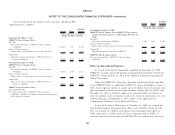
Average estimated fair value per equity instrument assumed .... $14.17 December 31, December 31, December 31,
Average exercise price per equity instrument assumed ........ $18.90 2011 2010 2009
Expected stock volatility ........................... 24.7% Average estimated fair value per equity
Range of risk-free interest rates ...................... 0.16 - 2.87% instrument assumed ............ $26.63 $22.52 $15.19
Range of expected option lives (in years) ................ 0.7 - 7.5 Average exercise price per equity
The intrinsic value of awards assumed under the LEI Plan which were instrument assumed ............ $16.51 $19.34 $20.06
exercised was $8 million during the year ended December 31, 2011, $145 million Expected stock volatility ........... 27.5% 26.5% 25.2%
during the year ended December 31, 2010 and $87 million during the year ended Range of risk-free interest rates ...... 0.06 - .83% 0.07 - 2.01% 0.19 - 3.34%
December 31, 2009. Range of expected option lives (in
years) ..................... 0.5 - 5.4 0.1 - 6.4 0.6 - 7.4
The holders of the majority of the equity instruments assumed as a result of
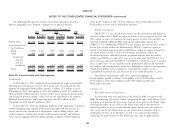
the Liberty Transaction did not become DIRECTV employees or directors. The following table presents the estimated weighted average fair value for the
Accordingly, we recognize those equity instruments as a liability that is subject to 1.0 million stock options granted during the year ended December 31, 2010 under
fair value measurement at each reporting date pursuant to accounting rules for the DIRECTV Plan using the Black-Scholes valuation model along with the
non-employee awards. We include that liability within ‘‘Other liabilities and assumptions used in the fair value calculations. Expected stock volatility is based
deferred credits’’ in our Consolidated Balance Sheets. Of the 16.7 million equity primarily on the historical volatility of our common stock. The risk-free rate for
instruments assumed on November 19, 2009, 8.8 million were held by persons periods within the contractual life of the option is based on the U.S. Treasury yield
other than employees or directors. As of December 31, 2010, there were curve in effect at the time of grant. The expected option life is based on historical
1.0 million non-employee awards outstanding with a fair value of approximately exercise behavior and other factors.
$22 million. As of December 31, 2011, 0.6 million non-employee awards remained
2010
outstanding with a fair value of approximately $15 million. We recorded net losses
of $4 million during the year ended December 31, 2011 and $11 million during Estimated fair value per option granted ....................... $12.36
the year ended December 31, 2010 to ‘‘Other, net’’ in the Consolidated Statements Average exercise price per option granted ...................... $33.74
of Operations for gains and losses recognized for exercised options and the Expected stock volatility ................................. 26.9%
adjustment of the liability to fair value. We recorded a net loss of $6 million during Risk-free interest rate ................................... 3.35%
the year ended December 31, 2009 to ‘‘Liberty transaction and related gains Expected option life (in years) ............................. 7.0
(charges)’’ in the Consolidated Statements of Operations for gains and losses
recognized for exercised options and the adjustment of the liability to fair value.
92