Cisco 2007 Annual Report Download - page 74
Download and view the complete annual report
Please find page 74 of the 2007 Cisco annual report below. You can navigate through the pages in the report by either clicking on the pages listed below, or by using the keyword search tool below to find specific information within the annual report.-
 1
1 -
2
-
3
-
4
-
5
-
6
-
7
-
8
-
9
-
10
-
11
-
12
-
13
-
14
-
15
-
16
-
17
-
18
-
19
-
20
-
21
-
22
-
23
-
24
-
25
-
26
-
27
-
28
-
29
-
30
-
31
-
32
-
33
-
34
-
35
-
36
-
37
-
38
-
39
-
40
-
41
-
42
-
43
-
44
-
45
-
46
-
47
-
48
-
49
-
50
-
51
-
52
-
53
-
54
-
55
-
56
-
57
-
58
-
59
-
60
-
61
-
62
-
63
-
 64
64 -
 65
65 -
 66
66 -
 67
67 -
 68
68 -
 69
69 -
 70
70 -
 71
71 -
 72
72 -
 73
73 -
 74
74 -
 75
75 -
 76
76 -
 77
77 -
 78
78 -
 79
79
 |
 |

2007 Annual Report 77
Notes to Consolidated Financial Statements
12. Segment Information and Major Customers
The Company’s operations involve the design, development, manufacturing, marketing, and technical support of networking and other
products and services related to the communications and information technology industry. Cisco products include routers, switches,
advanced technologies, and other products. These products, primarily integrated by Cisco IOS Software, link geographically dispersed
local-area networks (LANs) and wide-area networks (WANs).
The Company conducts business globally and is primarily managed on a geographic basis. The Company’s management makes
financial decisions and allocates resources based on the information it receives from its internal management system. Sales are attributed
to a geographic theater based on the ordering location of the customer. The Company does not allocate research and development,
sales and marketing, or general and administrative expenses to its geographic theaters in this internal management system because
management does not use the information to measure the performance of the operating segments. During fiscal 2007, the Company did
not allocate amortization of purchased intangible assets, employee share-based compensation expense, and the effects of purchase
accounting adjustments to inventory to the gross margin for each theater because management also does not use the information to
measure the performance of the operating segments. The Company has recast the measurement of gross margin for each theater for prior
years to conform to the current year’s presentation.
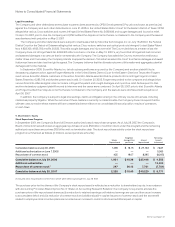
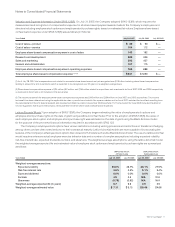
Summarized financial information by theater for fiscal 2007, 2006, and 2005, based on the Company’s internal management system
and as utilized by the Company’s chief operating decision maker (CODM), is as follows (in millions):
Years Ended July 28, 2007 July 29, 2006 July 30, 2005
Net sales:
United States and Canada(1) $ 19,294 $ 15,785 $ 13,298
European Markets 7,335 6,079 5,692
Emerging Markets 3,447 2,476 1,805
Asia Pacific 3,551 2,853 2,486
Japan 1,295 1,291 1,520
Total $ 34,922 $ 28,484 $ 24,801
Gross margin:
United States and Canada $ 12,414 $ 10,441 $ 8,784
European Markets 4,813 4,080 3,916
Emerging Markets 2,220 1,687 1,267
Asia Pacific 2,281 1,870 1,671
Japan 907 917 1,033
Theater total 22,635 18,995 16,671
Unallocated corporate items(2) (299) (248) —
Total $ 22,336 $ 18,747 $ 16,671
(1) Net sales in the United States were $18.2 billion, $15.0 billion, and $12.7 billion for fiscal 2007, 2006, and 2005, respectively.
(2) The unallocated corporate items for fiscal 2007 and 2006 primarily include the effects of amortization of purchased intangible assets and employee share-based
compensation expense. There was no amortization of purchased intangible assets recorded to cost of sales in fiscal 2005. In addition, there was no employee
share-based compensation expense in fiscal 2005 because the Company did not adopt the recognition provisions of SFAS 123.
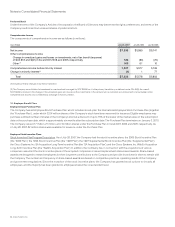
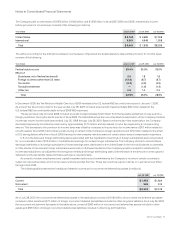
The following table presents net sales for groups of similar products and services (in millions):
Years Ended July 28, 2007 July 29, 2006 July 30, 2005
Net sales:
Routers $ 6,920 $ 6,005 $ 5,498
Switches 12,473 10,833 9,950
Advanced technologies 8,075 5,609 4,021
Other 1,994 1,470 1,384
Product 29,462 23,917 20,853
Service 5,460 4,567 3,948
Total $ 34,922 $ 28,484 $ 24,801