Cisco 2007 Annual Report Download - page 22
Download and view the complete annual report
Please find page 22 of the 2007 Cisco annual report below. You can navigate through the pages in the report by either clicking on the pages listed below, or by using the keyword search tool below to find specific information within the annual report.-
 1
1 -
2
-
3
-
4
-
5
-
6
-
7
-
8
-
9
-
10
-
11
-
 12
12 -
 13
13 -
 14
14 -
 15
15 -
 16
16 -
 17
17 -
 18
18 -
 19
19 -
 20
20 -
 21
21 -
 22
22 -
 23
23 -
 24
24 -
 25
25 -
 26
26 -
 27
27 -
 28
28 -
 29
29 -
 30
30 -
 31
31 -
 32
32 -
33
-
34
-
35
-
36
-
37
-
38
-
39
-
40
-
41
-
42
-
43
-
44
-
45
-
46
-
47
-
48
-
49
-
50
-
51
-
52
-
53
-
54
-
55
-
56
-
57
-
58
-
59
-
60
-
61
-
62
-
63
-
64
-
65
-
66
-
67
-
68
-
69
-
70
-
71
-
72
-
73
-
74
-
75
-
76
-
77
-
78
-
79
 |
 |

2007 Annual Report 25
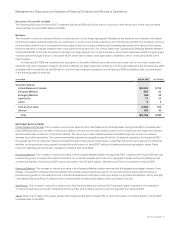
Management’s Discussion and Analysis of Financial Condition and Results of Operations
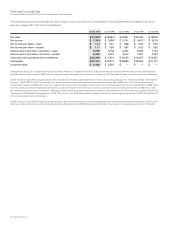
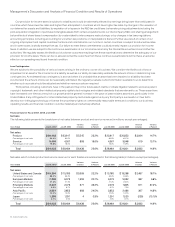
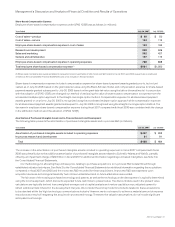
Net Product Sales
The following table presents the breakdown of net product sales by theater (in millions, except percentages):
Years Ended July 29, 2006
Variance
in Dollars
Variance
in Percent July 29, 2006 July 30, 2005
Variance
in Dollars
Variance
in PercentJuly 28, 2007
Net product sales:
United States and Canada $ 15,493 $ 12,601 $ 2,892 23.0% $ 12,601 $ 10,511 $ 2,090 19.9%
Percentage of net product sales 52.5% 52.7% 52.7% 50.4%
European Markets 6,506 5,339 1,167 21.9% 5,339 5,050 289 5.7%
Percentage of net product sales 22.1% 22.3% 22.3% 24.2%
Emerging Markets 3,151 2,296 855 37.2% 2,296 1,665 631 37.9%
Percentage of net product sales 10.7% 9.6% 9.6% 8.0%
Asia Pacific 3,169 2,550 619 24.3% 2,550 2,243 307 13.7%
Percentage of net product sales 10.8% 10.7% 10.7% 10.8%
Japan 1,143 1,131 12 1.1% 1,131 1,384 (253) (18.3)%
Percentage of net product sales 3.9% 4.7% 4.7% 6.6%
Total $ 29,462 $ 23,917 $ 5,545 23.2% $ 23,917 $ 20,853 $ 3,064 14.7%
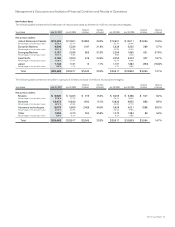
The following table presents net sales for groups of similar products (in millions, except percentages):
Years Ended July 29, 2006
Variance
in Dollars
Variance
in Percent July 29, 2006 July 30, 2005
Variance
in Dollars
Variance
in PercentJuly 28, 2007
Net product sales:
Routers $ 6,920 $ 6,005 $ 915 15.2% $ 6,005 $ 5,498 $ 507 9.2%
Percentage of net product sales 23.5% 25.1% 25.1% 26.4%
Switches 12,473 10,833 1,640 15.1% 10,833 9,950 883 8.9%
Percentage of net product sales 42.3% 45.3% 45.3% 47.7%
Advanced technologies 8,075 5,609 2,466 44.0% 5,609 4,021 1,588 39.5%
Percentage of net product sales 27.4% 23.5% 23.5% 19.3%
Other 1,994 1,470 524 35.6% 1,470 1,384 86 6.2%
Percentage of net product sales 6.8% 6.1% 6.1% 6.6%
Total $ 29,462 $ 23,917 $ 5,545 23.2% $ 23,917 $ 20,853 $ 3,064 14.7%