Cisco 2007 Annual Report Download - page 21
Download and view the complete annual report
Please find page 21 of the 2007 Cisco annual report below. You can navigate through the pages in the report by either clicking on the pages listed below, or by using the keyword search tool below to find specific information within the annual report.-
 1
1 -
2
-
3
-
4
-
5
-
6
-
7
-
8
-
9
-
10
-
 11
11 -
 12
12 -
 13
13 -
 14
14 -
 15
15 -
 16
16 -
 17
17 -
 18
18 -
 19
19 -
 20
20 -
 21
21 -
 22
22 -
 23
23 -
 24
24 -
 25
25 -
 26
26 -
 27
27 -
 28
28 -
 29
29 -
 30
30 -
 31
31 -
32
-
33
-
34
-
35
-
36
-
37
-
38
-
39
-
40
-
41
-
42
-
43
-
44
-
45
-
46
-
47
-
48
-
49
-
50
-
51
-
52
-
53
-
54
-
55
-
56
-
57
-
58
-
59
-
60
-
61
-
62
-
63
-
64
-
65
-
66
-
67
-
68
-
69
-
70
-
71
-
72
-
73
-
74
-
75
-
76
-
77
-
78
-
79
 |
 |

24 Cisco Systems, Inc.
Management’s Discussion and Analysis of Financial Condition and Results of Operations
Our provision for income taxes is subject to volatility and could be adversely affected by earnings being lower than anticipated in
countries which have lower tax rates and higher than anticipated in countries which have higher tax rates; by changes in the valuation of
our deferred tax assets and liabilities; by expiration of or lapses in the R&D tax credit laws; by transfer pricing adjustments including the
post-acquisition integration of purchased intangible assets from certain acquisitions into our intercompany R&D cost sharing arrangement;
by tax effects of share-based compensation; by costs related to intercompany restructurings; or by changes in tax laws, regulations,
accounting principles, including accounting for uncertain tax positions, or interpretations thereof. Further, as a result of certain of our
ongoing employment and capital investment actions and commitments, our income in certain countries is subject to reduced tax rates,
and in some cases is wholly exempt from tax. Our failure to meet these commitments could adversely impact our provision for income
taxes. In addition, we are subject to the continuous examination of our income tax returns by the Internal Revenue Service and other tax
authorities. We regularly assess the likelihood of adverse outcomes resulting from these examinations to determine the adequacy of our
provision for income taxes. There can be no assurance that the outcomes from these continuous examinations will not have an adverse
effect on our operating results and financial condition.
Loss Contingencies
We are subject to the possibility of various losses arising in the ordinary course of business. We consider the likelihood of loss or
impairment of an asset or the incurrence of a liability, as well as our ability to reasonably estimate the amount of loss, in determining loss
contingencies. An estimated loss contingency is accrued when it is probable that an asset has been impaired or a liability has been
incurred and the amount of loss can be reasonably estimated. We regularly evaluate current information available to us to determine
whether such accruals should be adjusted and whether new accruals are required.
Third parties, including customers, have in the past and may in the future assert claims or initiate litigation related to exclusive patent,
copyright, trademark, and other intellectual property rights to technologies and related standards that are relevant to us. These assertions
have increased over time as a result of our growth and the general increase in the pace of patent claims assertions, particularly in the
United States. If any infringement or other intellectual property claim made against us by any third party is successful, or if we fail to
develop non-infringing technology or license the proprietary rights on commercially reasonable terms and conditions, our business,
operating results, and financial condition could be materially and adversely affected.
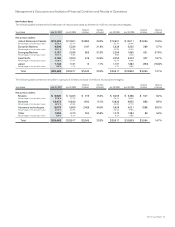
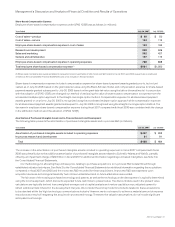
Financial Data for Fiscal 2007, 2006, and 2005
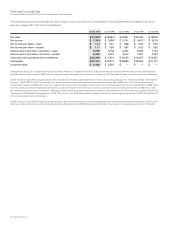
Net Sales
The following table presents the breakdown of net sales between product and service revenue (in millions, except percentages):
Years Ended July 29, 2006
Variance
in Dollars
Variance
in Percent July 29, 2006 July 30, 2005
Variance
in Dollars
Variance
in PercentJuly 28, 2007
Net sales:
Product $ 29,462 $ 23,917 $ 5,545 23.2% $ 23,917 $ 20,853 $ 3,064 14.7%
Percentage of net sales 84.4% 84.0% 84.0% 84.1%
Service 5,460 4,567 893 19.6% 4,567 3,948 619 15.7%
Percentage of net sales 15.6% 16.0% 16.0% 15.9%
Total $ 34,922 $ 28,484 $ 6,438 22.6% $ 28,484 $ 24,801 $ 3,683 14.9%
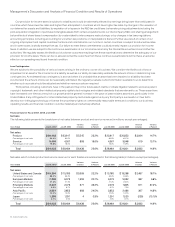
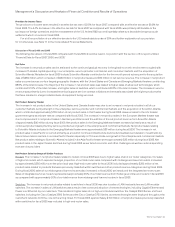
Net sales, which include product and service revenue, for each theater are summarized in the following table (in millions, except percentages):
Years Ended July 29, 2006
Variance
in Dollars
Variance
in Percent July 29, 2006 July 30, 2005
Variance
in Dollars
Variance
in PercentJuly 28, 2007
Net sales:
United States and Canada $ 19,294 $ 15,785 $ 3,509 22.2% $ 15,785 $ 13,298 $ 2,487 18.7%
Percentage of net sales 55.2% 55.4% 55.4% 53.6%
European Markets 7,335 6,079 1,256 20.7% 6,079 5,692 387 6.8%
Percentage of net sales 21.0% 21.4% 21.4% 23.0%
Emerging Markets 3,447 2,476 971 39.2% 2,476 1,805 671 37.2%
Percentage of net sales 9.9% 8.7% 8.7% 7.3%
Asia Pacific 3,551 2,853 698 24.5% 2,853 2,486 367 14.8%
Percentage of net sales 10.2% 10.0% 10.0% 10.0%
Japan 1,295 1,291 4 0.3% 1,291 1,520 (229) (15.1)%
Percentage of net sales 3.7% 4.5% 4.5% 6.1%
Total $ 34,922 $ 28,484 $ 6,438 22.6% $ 28,484 $ 24,801 $ 3,683 14.9%