Cisco 2007 Annual Report Download - page 45
Download and view the complete annual report
Please find page 45 of the 2007 Cisco annual report below. You can navigate through the pages in the report by either clicking on the pages listed below, or by using the keyword search tool below to find specific information within the annual report.-
 1
1 -
2
-
3
-
4
-
5
-
6
-
7
-
8
-
9
-
10
-
11
-
12
-
13
-
14
-
15
-
16
-
17
-
18
-
19
-
20
-
21
-
22
-
23
-
24
-
25
-
26
-
27
-
28
-
29
-
30
-
31
-
32
-
33
-
34
-
 35
35 -
 36
36 -
 37
37 -
 38
38 -
 39
39 -
 40
40 -
 41
41 -
 42
42 -
 43
43 -
 44
44 -
 45
45 -
 46
46 -
 47
47 -
 48
48 -
 49
49 -
 50
50 -
 51
51 -
 52
52 -
 53
53 -
 54
54 -
 55
55 -
56
-
57
-
58
-
59
-
60
-
61
-
62
-
63
-
64
-
65
-
66
-
67
-
68
-
69
-
70
-
71
-
72
-
73
-
74
-
75
-
76
-
77
-
78
-
79
 |
 |

48 Cisco Systems, Inc.
Shares of
Common
Stock
Common Stock
and
Additional
Paid-In Capital
Retained
Earnings
(Accumulated
Deficit)
Accumulated
Other
Comprehensive
Income
Total
Shareholders’
Equity
BALANCE AT JULY 31, 2004 6,735 $ 22,450 $ 3,164 $ 212 $ 25,826
Net income — — 5,741 — 5,741
Change in unrealized gains and losses on investments, net of tax — — — 52 52
Other — — — 10 10
Comprehensive income 5,803
Issuance of common stock 112 1,087 — — 1,087
Repurchase of common stock (540) (1,836) (8,399) — (10,235)
Tax benefits from employee stock incentive plans — 35 — — 35
Purchase acquisitions 24 504 — — 504
Share-based compensation expense related to acquisitions and investments — 154 — — 154
BALANCE AT JULY 30, 2005 6,331 $ 22,394 $ 506 $ 274 $ 23,174
Net income — — 5,580 — 5,580
Change in unrealized gains and losses on investments, net of tax — — — (63) (63)
Other — — — 61 61
Comprehensive income 5,578
Issuance of common stock 162 1,682 — — 1,682
Repurchase of common stock (435) (1,592) (6,703) — (8,295)
Tax benefits from employee stock incentive plans — 454 — — 454
Purchase acquisitions 1 188 — — 188
Employee share-based compensation expense — 1,044 — — 1,044
Share-based compensation expense related to acquisitions and investments — 87 — — 87
BALANCE AT JULY 29, 2006 6,059 $ 24,257 $ (617) $ 272 $ 23,912
Net income — — 7,333 — 7,333
Change in unrealized gains and losses on investments, net of tax — — — 124 124
Other — — — 166 166
Comprehensive income 7,623
Issuance of common stock 325 5,306 — — 5,306
Repurchase of common stock (297) (1,296) (6,485) — (7,781)
Tax benefits from employee stock incentive plans — 995 — — 995
Purchase acquisitions 13 462 — — 462
Employee share-based compensation expense — 929 — — 929
Share-based compensation expense related to acquisitions
and investments — 34 — — 34
BALANCE AT JULY 28, 2007 6,100 $ 30,687 $ 231 $ 562 $ 31,480
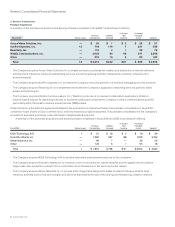
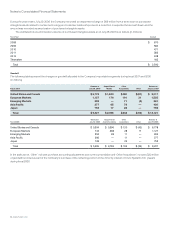
Supplemental Information
In September 2001, the Company’s Board of Directors authorized a stock repurchase program. As of July 28, 2007, the Company’s Board of Directors had authorized an
aggregate repurchase of up to $52 billion of common stock under this program. For additional information regarding stock repurchases, see Note 9 to the Consolidated
Financial Statements. The stock repurchases since the inception of this program are summarized in the table below (in millions):
Shares of
Common
Stock
Common Stock
and
Additional
Paid-In Capital
Retained
Earnings
(Accumulated
Deficit)
Accumulated
Other
Comprehensive
Income
Total
Shareholders’
Equity
Repurchases of common stock 2,228 $ 7,590 $ 35,639 $ — $ 43,229
See Notes to Consolidated Financial Statements.
Consolidated Statements of Shareholders’ Equity
(in millions)