Cisco 2007 Annual Report Download - page 30
Download and view the complete annual report
Please find page 30 of the 2007 Cisco annual report below. You can navigate through the pages in the report by either clicking on the pages listed below, or by using the keyword search tool below to find specific information within the annual report.-
 1
1 -
2
-
3
-
4
-
5
-
6
-
7
-
8
-
9
-
10
-
11
-
12
-
13
-
14
-
15
-
16
-
17
-
18
-
19
-
 20
20 -
 21
21 -
 22
22 -
 23
23 -
 24
24 -
 25
25 -
 26
26 -
 27
27 -
 28
28 -
 29
29 -
 30
30 -
 31
31 -
 32
32 -
 33
33 -
 34
34 -
 35
35 -
 36
36 -
 37
37 -
 38
38 -
 39
39 -
 40
40 -
41
-
42
-
43
-
44
-
45
-
46
-
47
-
48
-
49
-
50
-
51
-
52
-
53
-
54
-
55
-
56
-
57
-
58
-
59
-
60
-
61
-
62
-
63
-
64
-
65
-
66
-
67
-
68
-
69
-
70
-
71
-
72
-
73
-
74
-
75
-
76
-
77
-
78
-
79
 |
 |

2007 Annual Report 33
Management’s Discussion and Analysis of Financial Condition and Results of Operations
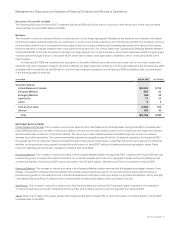
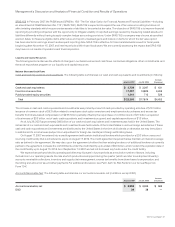
Provision for Income Taxes
The provision for income taxes resulted in an effective tax rate of 22.5% for fiscal 2007, compared with an effective tax rate of 26.9% for
fiscal 2006. The 4.4% decrease in the effective tax rate for fiscal 2007, as compared with fiscal 2006, was primarily attributable to the
tax impact of foreign operations and the reinstatement of the U.S. federal R&D tax credit partially offset by a favorable foreign tax audit
settlement which occurred in fiscal 2006.
For a full reconciliation of our effective tax rate to the U.S. federal statutory rate of 35% and further explanation of our provision
for income taxes, see Note 11 to the Consolidated Financial Statements.
Discussion of Fiscal 2006 and 2005
The following discussion of fiscal 2006 compared with fiscal 2005 should be read in conjunction with the section of this report entitled
“Financial Data for Fiscal 2007, 2006, and 2005.”
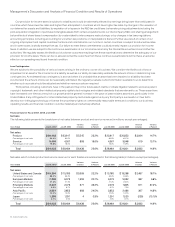
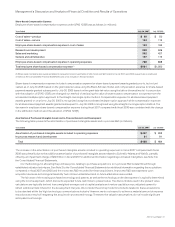
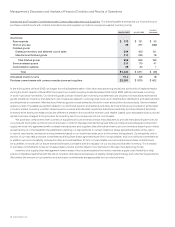
Net Sales
The increase in net product sales can be attributed to the continued gradual recovery in the global economic environment coupled with
increased IT-related capital spending in our enterprise, service provider, commercial, and consumer markets, and the acquisition of
Scientific-Atlanta. Net sales for fiscal 2006 include Scientific-Atlanta’s contribution for the five-month period subsequent to the acquisition
date of $989 million, which consisted of $939 million in net product sales and $50 million in net service revenue. The increase in net product
sales occurred across our four largest geographic theaters, with the United States and Canada and Emerging Markets theaters contributing
88.8% of the total increase. The majority of the increase in net product sales was related to higher sales of advanced technologies, which
contributed 51.8% of the total increase, and higher sales of switches, which contributed 28.8% of the total increase. The increase in service
revenue was primarily due to increased technical support service contract initiations and renewals associated with higher product sales
that have resulted in a larger installed base of equipment being serviced.
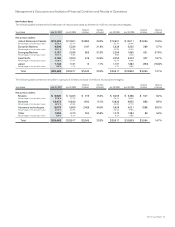
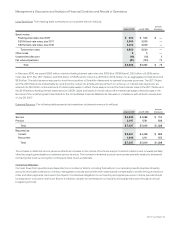
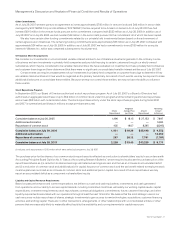
Net Product Sales by Theater
The increase in net product sales in the United States and Canada theater was due to an increase in net product sales in all of our
customer markets, led by strength in the enterprise, service provider and commercial markets, and the acquisition of Scientific-Atlanta,
which contributed approximately $755 million of net product sales in this theater during fiscal 2006. However, sales to the U.S. federal
government grew at a slower rate as compared with fiscal 2005. The increase in net product sales in the European Markets theater was
due to improvement in net product sales in Germany and France and the addition of the net product revenue from Scientific-Atlanta
of approximately $90 million during fiscal 2006. Net product sales in the Emerging Markets theater increased primarily as a result of
continued product deployment by service providers and growth in the enterprise and commercial markets. Net product sales relating
to Scientific-Atlanta included in the Emerging Markets theater were approximately $65 million during fiscal 2006. The increase in net
product sales in Asia Pacific occurred primarily as a result of continued infrastructure build outs, broadband acceleration, investments by
telecommunications carriers in our Asia Pacific theater, especially in China and India, and growth in the enterprise and commercial markets.
Net product sales relating to Scientific-Atlanta included in the Asia Pacific theater were approximately $25 million during fiscal 2006. Net
product sales in the Japan theater declined during fiscal 2006, as we faced economic and other challenges, as well as cautious spending
from service providers.
Net Product Sales by Groups of Similar Products
Routers The increase in net product sales related to routers in fiscal 2006 was due to higher sales of all of our router categories. Our sales
of high-end routers, which represent a larger proportion of our total router sales compared with midrange and low-end routers, increased
by approximately $350 million over the prior fiscal year. High-end router sales for fiscal 2006 included approximately $200 million of net
product sales related to products that were previously classified within switches and other product revenue categories during fiscal 2005.
During fiscal 2006, sales of our midrange and low-end routers also increased. In fiscal 2005, we introduced the integrated services router.
Sales of integrated services routers represented approximately 45% of our total revenue from midrange and low-end routers in fiscal 2006
as compared with approximately 20% of our total revenue from midrange and low-end routers in fiscal 2005.
Switches The increase in net product sales related to switches in fiscal 2006 was due to sales of LAN fixed switches and LAN modular
switches. The increase in sales of LAN switches was a result of the continued adoption of new technologies, including Gigabit Ethernet and
Power over Ethernet, by our customers. This resulted in higher sales of our high-end modular switches, the Catalyst 6500 Series, and fixed
switches, including the Cisco Catalyst 3560 Series and the Cisco Catalyst 3750 Series, as new technologies were deployed throughout the
customers’ networks from the core to the wiring closet. For fiscal 2006, approximately $150 million of net product sales previously classified
within switches for fiscal 2005 was included in high-end router sales.