Cisco 2007 Annual Report Download - page 42
Download and view the complete annual report
Please find page 42 of the 2007 Cisco annual report below. You can navigate through the pages in the report by either clicking on the pages listed below, or by using the keyword search tool below to find specific information within the annual report.-
 1
1 -
2
-
3
-
4
-
5
-
6
-
7
-
8
-
9
-
10
-
11
-
12
-
13
-
14
-
15
-
16
-
17
-
18
-
19
-
20
-
21
-
22
-
23
-
24
-
25
-
26
-
27
-
28
-
29
-
30
-
31
-
 32
32 -
 33
33 -
 34
34 -
 35
35 -
 36
36 -
 37
37 -
 38
38 -
 39
39 -
 40
40 -
 41
41 -
 42
42 -
 43
43 -
 44
44 -
 45
45 -
 46
46 -
 47
47 -
 48
48 -
 49
49 -
 50
50 -
 51
51 -
 52
52 -
53
-
54
-
55
-
56
-
57
-
58
-
59
-
60
-
61
-
62
-
63
-
64
-
65
-
66
-
67
-
68
-
69
-
70
-
71
-
72
-
73
-
74
-
75
-
76
-
77
-
78
-
79
 |
 |
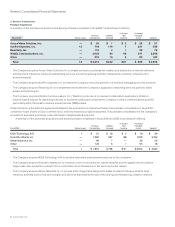
2007 Annual Report 45
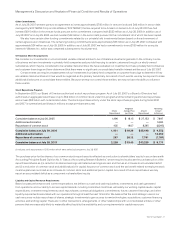
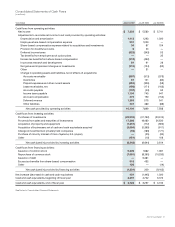
Consolidated Statements of Operations
(in millions, except per-share amounts)
Years Ended July 28, 2007 July 29, 2006 July 30, 2005
NET SALES:
Product $ 29,462 $ 23,917 $ 20,853
Service 5,460 4,567 3,948
Total net sales 34,922 28,484 24,801
COST OF SALES:
Product 10,548 8,114 6,758
Service 2,038 1,623 1,372
Total cost of sales 12,586 9,737 8,130
GROSS MARGIN 22,336 18,747 16,671
OPERATING EXPENSES:
Research and development 4,499 4,067 3,322
Sales and marketing 7,215 6,031 4,721
General and administrative 1,513 1,169 959
Amortization of purchased intangible assets 407 393 227
In-process research and development 81 91 26
Total operating expenses 13,715 11,751 9,255
OPERATING INCOME 8,621 6,996 7,416
Interest income, net 715 607 552
Other income, net 125 30 68
Interest and other income, net 840 637 620
INCOME BEFORE PROVISION FOR INCOME TAXES 9,461 7,633 8,036
Provision for income taxes 2,128 2,053 2,295
NET INCOME $ 7,333 $ 5,580 $ 5,741
Net income per share—basic $ 1.21 $ 0.91 $ 0.88
Net income per share—diluted $ 1.17 $ 0.89 $ 0.87
Shares used in per-share calculation—basic 6,055 6,158 6,487
Shares used in per-share calculation—diluted 6,265 6,272 6,612
Net income for fiscal 2007 and 2006 included share-based compensation expense under Statement of Financial Accounting Standards No. 123 (revised 2004),
“Share-Based Payment,” (“SFAS 123(R)”). See Note 10 to the Consolidated Financial Statements for additional information.
See Notes to Consolidated Financial Statements.