Cisco 2007 Annual Report Download - page 32
Download and view the complete annual report
Please find page 32 of the 2007 Cisco annual report below. You can navigate through the pages in the report by either clicking on the pages listed below, or by using the keyword search tool below to find specific information within the annual report.-
 1
1 -
2
-
3
-
4
-
5
-
6
-
7
-
8
-
9
-
10
-
11
-
12
-
13
-
14
-
15
-
16
-
17
-
18
-
19
-
20
-
21
-
 22
22 -
 23
23 -
 24
24 -
 25
25 -
 26
26 -
 27
27 -
 28
28 -
 29
29 -
 30
30 -
 31
31 -
 32
32 -
 33
33 -
 34
34 -
 35
35 -
 36
36 -
 37
37 -
 38
38 -
 39
39 -
 40
40 -
 41
41 -
 42
42 -
43
-
44
-
45
-
46
-
47
-
48
-
49
-
50
-
51
-
52
-
53
-
54
-
55
-
56
-
57
-
58
-
59
-
60
-
61
-
62
-
63
-
64
-
65
-
66
-
67
-
68
-
69
-
70
-
71
-
72
-
73
-
74
-
75
-
76
-
77
-
78
-
79
 |
 |

2007 Annual Report 35
Management’s Discussion and Analysis of Financial Condition and Results of Operations
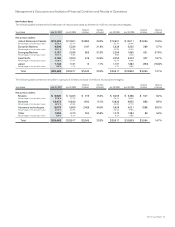
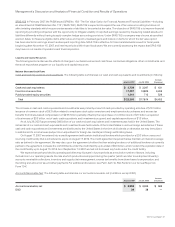
Research and Development, Sales and Marketing, and General and Administrative Expenses
R&D expenses increased for fiscal 2006 compared with fiscal 2005 primarily due to higher headcount-related expenses reflecting our
continued investment in R&D efforts in routers, switches, advanced technologies and other product technologies; the effect of employee
share-based compensation expense under SFAS 123(R); and the acquisition of Scientific-Atlanta. R&D expenses include $346 million
of employee share-based compensation expense under SFAS 123(R), and Scientific-Atlanta contributed $90 million of additional R&D
expenses. All of our R&D costs have been expensed as incurred.
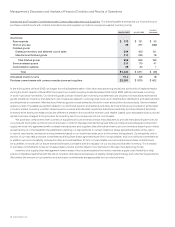
Sales and marketing expenses for fiscal 2006 increased compared with fiscal 2005 primarily due to an increase in sales expenses
of approximately $1.1 billion. Sales expenses increased primarily due to an increase in headcount-related expenses, an increase in sales
program expenses, and the acquisition of Scientific-Atlanta, which added approximately $30 million of sales expenses. Sales expenses
also include employee share-based compensation expense under SFAS 123(R) of $337 million during fiscal 2006. Marketing expenses
include $90 million of employee share-based compensation expense under SFAS 123(R) during fiscal 2006. Scientific-Atlanta added
approximately $20 million of marketing expenses.
G&A expenses for fiscal 2006 increased compared with fiscal 2005 primarily because of employee share-based compensation
expense under SFAS 123(R), and the acquisition of Scientific-Atlanta. G&A expenses include $115 million of employee share-based
compensation expense under SFAS 123(R). Scientific-Atlanta contributed approximately $40 million of G&A expenses.
Headcount
Our headcount increased by approximately 11,500 employees in fiscal 2006. Approximately 8,000 of the new employees were attributable
to acquisitions we completed in fiscal 2006.
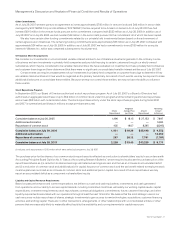
Share-Based Compensation Expense
On July 31, 2005, we adopted SFAS 123(R) which requires the measurement and recognition of compensation expense for all share-based
payment awards made to employees and directors including employee stock options and employee stock purchase rights based
on estimated fair values. In fiscal 2006, employee share-based compensation expense was $1.0 billion and share-based compensation
expense related to acquisitions and investments was $87 million. There was no share-based compensation expense recognized for fiscal
2005 other than as related to acquisitions and investments.
Amortization of Purchased Intangible Assets and In-Process Research and Development
Amortization of purchased intangible assets included in operating expenses was $393 million in fiscal 2006, compared with $227 million in
fiscal 2005. The increase was related primarily to additional amortization from the Scientific-Atlanta acquisition and an impairment charge
of $69 million from a write down of purchased intangible assets related to certain technology and customer relationships due to a reduction
in expected future cash flows. For additional information regarding our purchased intangible assets, see Note 3 to the Consolidated
Financial Statements.
We recorded in-process R&D of $91 million in fiscal 2006 in connection with the purchase acquisitions completed. The total estimated
cost to complete the technology at the time of these acquisitions was $95 million and the risk-adjusted discount rates for the in-process
R&D recorded in connection with the acquisitions completed in fiscal 2006 ranged from 17% to 22%. We recorded in-process R&D of
$26 million in fiscal 2005 in connection with the purchase acquisitions completed. The total estimated cost to complete the technology
at the time of these acquisitions was $11 million and the risk-adjusted discount rates for the in-process R&D recorded in connection with
the acquisitions completed in fiscal 2005 ranged from 20% to 24%.
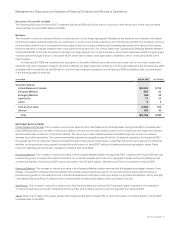
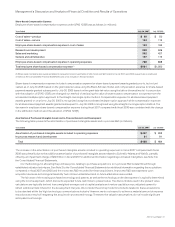
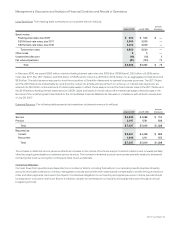
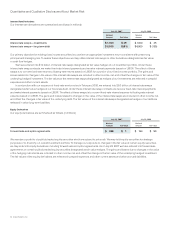
Interest Income, Net
The components of interest income, net, are as follows (in millions):
Years Ended July 29, 2006 July 30, 2005
Interest income $ 755 $ 552
Interest expense (148) —
Total $ 607 $ 552
The increase in interest income was primarily due to higher average interest rates on our portfolio of cash and cash equivalents and
fixed-income securities. The interest expense was attributable to the issuance of $6.5 billion in senior unsecured notes, and included the
effect of $6.0 billion of interest rate swaps.