Cisco 2007 Annual Report Download - page 27
Download and view the complete annual report
Please find page 27 of the 2007 Cisco annual report below. You can navigate through the pages in the report by either clicking on the pages listed below, or by using the keyword search tool below to find specific information within the annual report.-
 1
1 -
2
-
3
-
4
-
5
-
6
-
7
-
8
-
9
-
10
-
11
-
12
-
13
-
14
-
15
-
16
-
 17
17 -
 18
18 -
 19
19 -
 20
20 -
 21
21 -
 22
22 -
 23
23 -
 24
24 -
 25
25 -
 26
26 -
 27
27 -
 28
28 -
 29
29 -
 30
30 -
 31
31 -
 32
32 -
 33
33 -
 34
34 -
 35
35 -
 36
36 -
 37
37 -
38
-
39
-
40
-
41
-
42
-
43
-
44
-
45
-
46
-
47
-
48
-
49
-
50
-
51
-
52
-
53
-
54
-
55
-
56
-
57
-
58
-
59
-
60
-
61
-
62
-
63
-
64
-
65
-
66
-
67
-
68
-
69
-
70
-
71
-
72
-
73
-
74
-
75
-
76
-
77
-
78
-
79
 |
 |

30 Cisco Systems, Inc.
Management’s Discussion and Analysis of Financial Condition and Results of Operations
Product gross margin may continue to be adversely affected in the future by: changes in the mix of products sold, including further periods
of increased growth of some of our lower-margin products; introduction of new products, including products with price-performance
advantages; our ability to reduce production costs; entry into new markets, including markets with different pricing structures and cost
structures, as a result of internal development or through acquisitions; changes in distribution channels; price competition, including
competitors from Asia and especially China; changes in geographic mix; sales discounts; increases in material or labor costs; excess
inventory and obsolescence charges; warranty costs; changes in shipment volume; loss of cost savings due to changes in component
pricing; impact of value engineering; inventory holding charges; and how well we execute on our strategy and operating plans.
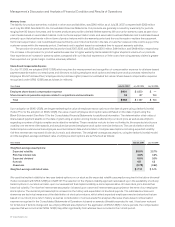
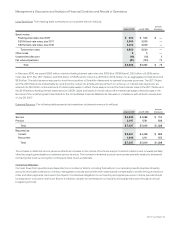
Service Gross Margin
Our service gross margin percentage for fiscal 2007 decreased from fiscal 2006, primarily due to strategic investments in headcount as
well as advanced services representing a higher proportion of service revenue. Additionally, we have continued to invest in building out
our technical support and advanced services capabilities in the Emerging Markets theater.
Service gross margin will typically experience some variability over time due to various factors such as the change in mix between
technical support services and advanced services, as well as the timing of technical support service contract initiations and renewals and
the timing of our adding personnel and resources to support this business. Our service gross margin from technical support services is
higher than the service gross margin from our advanced services and our revenue from advanced services may continue to increase to a
higher proportion of total service revenue due to our continued focus on providing comprehensive support to our customers’ networking
devices, applications, and infrastructures.
Research and Development, Sales and Marketing, and General and Administrative Expenses
R&D Expenses R&D expenses increased for fiscal 2007 compared with fiscal 2006 primarily due to higher headcount-related expenses
reflecting our continued investment in R&D efforts for routers, switches, advanced technologies and other product technologies.
Scientific-Atlanta contributed an additional $153 million of R&D expenses for fiscal 2007 compared with fiscal 2006. R&D expenses
included employee share-based compensation expense which decreased by $57 million compared with fiscal 2006. We have also
continued to purchase or license technology in order to bring a broad range of products to market in a timely fashion. If we believe that
we are unable to enter a particular market in a timely manner with internally developed products, we may license technology from other
businesses or acquire businesses as an alternative to internal R&D. All of our R&D costs have been expensed as incurred.
Sales and Marketing Expenses Sales and marketing expenses for fiscal 2007 increased compared with fiscal 2006 primarily due to
an increase in sales expenses of $998 million. Sales expenses increased primarily due to an increase in headcount-related expenses.
Scientific-Atlanta contributed an additional $86 million of sales and marketing expenses for fiscal 2007 compared with fiscal 2006.
Sales and marketing expenses for fiscal 2007 included employee share-based compensation expense which decreased by $35 million
compared with fiscal 2006.
G&A Expenses G&A expenses for fiscal 2007 increased compared with fiscal 2006 primarily due to increased headcount-related
expenses and approximately $65 million of real estate-related charges. Also, Scientific-Atlanta contributed an additional $54 million
of G&A expenses for fiscal 2007 compared with fiscal 2006.
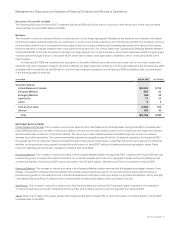
Headcount
Our headcount increased by 11,609 employees during fiscal 2007, reflecting the investment in R&D and sales described above and also
reflecting increases in investments in our service business; our Juarez, Mexico manufacturing facility; and acquisitions. Approximately
3,300 of the new employees were attributable to acquisitions we completed in fiscal 2007. Our headcount is expected to increase, as we
continue to invest in engineering and sales headcount. As a result, if we do not achieve the benefits anticipated from these investments,
our operating results may be adversely affected.