Cisco 2007 Annual Report Download - page 34
Download and view the complete annual report
Please find page 34 of the 2007 Cisco annual report below. You can navigate through the pages in the report by either clicking on the pages listed below, or by using the keyword search tool below to find specific information within the annual report.-
 1
1 -
2
-
3
-
4
-
5
-
6
-
7
-
8
-
9
-
10
-
11
-
12
-
13
-
14
-
15
-
16
-
17
-
18
-
19
-
20
-
21
-
22
-
23
-
 24
24 -
 25
25 -
 26
26 -
 27
27 -
 28
28 -
 29
29 -
 30
30 -
 31
31 -
 32
32 -
 33
33 -
 34
34 -
 35
35 -
 36
36 -
 37
37 -
 38
38 -
 39
39 -
 40
40 -
 41
41 -
 42
42 -
 43
43 -
 44
44 -
45
-
46
-
47
-
48
-
49
-
50
-
51
-
52
-
53
-
54
-
55
-
56
-
57
-
58
-
59
-
60
-
61
-
62
-
63
-
64
-
65
-
66
-
67
-
68
-
69
-
70
-
71
-
72
-
73
-
74
-
75
-
76
-
77
-
78
-
79
 |
 |

2007 Annual Report 37
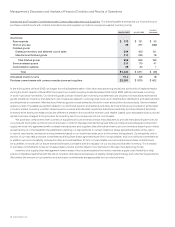
Management’s Discussion and Analysis of Financial Condition and Results of Operations
SFAS 159 In February 2007, the FASB issued SFAS No. 159, “The Fair Value Option for Financial Assets and Financial Liabilities—Including
an amendment of FASB Statement No. 115” (“SFAS 159”). SFAS 159 is expected to expand the use of fair value accounting but does not
affect existing standards which require certain assets or liabilities to be carried at fair value. The objective of SFAS 159 is to improve financial
reporting by providing companies with the opportunity to mitigate volatility in reported earnings caused by measuring related assets and
liabilities differently without having to apply complex hedge accounting provisions. Under SFAS 159, a company may choose, at specified
election dates, to measure eligible items at fair value and report unrealized gains and losses on items for which the fair value option
has been elected in earnings at each subsequent reporting date. SFAS 159 is effective for financial statements issued for fiscal years
beginning after November 15, 2007, and interim periods within those fiscal years. We are currently assessing the impact that SFAS 159
may have on our results of operations and financial position.
Liquidity and Capital Resources
The following sections discuss the effects of changes in our balance sheet and cash flows, contractual obligations, other commitments, and
the stock repurchase program on our liquidity and capital resources.
Balance Sheet and Cash Flows
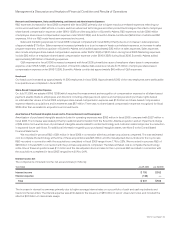
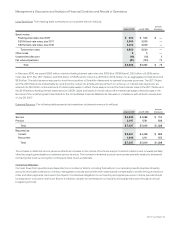
Cash and Cash Equivalents and Investments The following table summarizes our cash and cash equivalents and investments (in millions):
July 29, 2006
Increase
(Decrease)July 28, 2007
Cash and cash equivalents $ 3,728 $ 3,297 $ 431
Fixed income securities 17,297 13,805 3,492
Publicly traded equity securities 1,241 712 529
Total $ 22,266 $ 17,814 $ 4,452
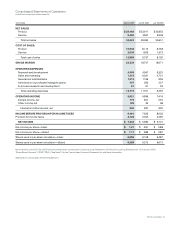
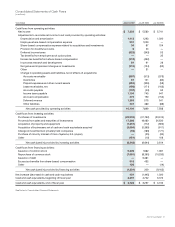
The increase in cash and cash equivalents and investments was primarily a result of cash provided by operating activities of $10.1 billion;
issuance of common stock of $5.3 billion related to employee stock option exercises and employee stock purchases; and excess tax
benefits from share-based compensation of $918 million; partially offset by the repurchase of common stock of $7.7 billion; acquisition
of businesses of $3.3 billion, net of cash, cash equivalents, and investments acquired; and capital expenditures of $1.3 billion.
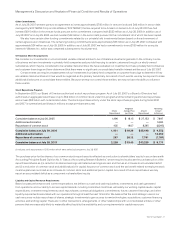
As of July 28, 2007, approximately $4.8 billion of our cash and cash equivalents and investments was held in the United States. The
remainder of our cash and cash equivalents and investments was held outside of the United States in various foreign subsidiaries. If these
cash and cash equivalents and investments are distributed to the United States in the form of dividends or otherwise, we may be subject
to additional U.S. income taxes (subject to an adjustment for foreign tax credits) and foreign withholding taxes.
On August 17, 2007, we entered into a credit agreement with certain institutional lenders which provides for a $3.0 billion unsecured
revolving credit facility that is scheduled to expire on August 17, 2012. The credit agreement requires that we maintain an interest coverage
ratio as defined in the agreement. We may also, upon the agreement of either the then existing lenders or of additional lenders not currently
parties to the agreement, increase the commitments under the credit facility up to a total of $5.0 billion, and/or extend the expiration date of
the credit facility up to August 15, 2014. As of September 14, 2007, we had not borrowed any funds under the credit facility.
We expect that cash provided by operating activities may fluctuate in future periods as a result of a number of factors, including
fluctuations in our operating results, the rate at which products are shipped during the quarter (which we refer to as shipment linearity),
accounts receivable collections, inventory and supply chain management, excess tax benefits from share-based compensation, and
the timing and amount of tax and other payments. For additional discussion, see Part I, Item 1A. Risk Factors in our Annual Report on
Form 10-K.
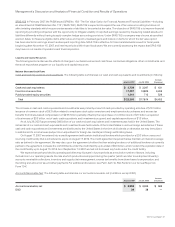
Accounts Receivable, Net The following table summarizes our accounts receivable, net (in millions, except DSO):
July 29, 2006
Increase
(Decrease)July 28, 2007
Accounts receivable, net $ 3,989 $ 3,303 $ 686
DSO 38 38 —