Cisco 2007 Annual Report Download - page 15
Download and view the complete annual report
Please find page 15 of the 2007 Cisco annual report below. You can navigate through the pages in the report by either clicking on the pages listed below, or by using the keyword search tool below to find specific information within the annual report.-
 1
1 -
2
-
3
-
4
-
 5
5 -
 6
6 -
 7
7 -
 8
8 -
 9
9 -
 10
10 -
 11
11 -
 12
12 -
 13
13 -
 14
14 -
 15
15 -
 16
16 -
 17
17 -
 18
18 -
 19
19 -
 20
20 -
 21
21 -
 22
22 -
 23
23 -
 24
24 -
 25
25 -
26
-
27
-
28
-
29
-
30
-
31
-
32
-
33
-
34
-
35
-
36
-
37
-
38
-
39
-
40
-
41
-
42
-
43
-
44
-
45
-
46
-
47
-
48
-
49
-
50
-
51
-
52
-
53
-
54
-
55
-
56
-
57
-
58
-
59
-
60
-
61
-
62
-
63
-
64
-
65
-
66
-
67
-
68
-
69
-
70
-
71
-
72
-
73
-
74
-
75
-
76
-
77
-
78
-
79
 |
 |

18 Cisco Systems, Inc.
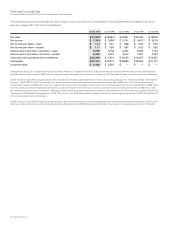
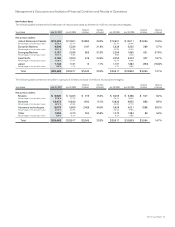
Selected Financial Data
Five Years Ended July 28, 2007 (in millions, except per-share amounts)
The following selected financial data should be read in conjunction with the Consolidated Financial Statements and related notes which
appear on pages 45 to 78 of this Annual Report:
July 28, 2007 July 29, 2006 July 30, 2005 July 31, 2004 July 26, 2003
Net sales $ 34,922
(1)
$ 28,484(1) $ 24,801 $ 22,045 $ 18,878
Net income $ 7,333
(2)
$ 5,580(2) $ 5,741 $ 4,401(3) $ 3,578
Net income per share—basic $ 1.21 $ 0.91 $ 0.88 $ 0.64 $ 0.50
Net income per share—diluted $ 1.17 $ 0.89 $ 0.87 $ 0.62 $ 0.50
Shares used in per-share calculation—basic 6,055 6,158 6,487 6,840 7,124
Shares used in per-share calculation—diluted 6,265 6,272 6,612 7,057 7,223
Cash and cash equivalents and investments $ 22,266 $ 17,814 $ 16,055 $ 19,267 $ 20,652
Total assets $ 53,340 $ 43,315 $ 33,883 $ 35,594 $ 37,107
Long-term debt $ 6,408 $ 6,332 $ — $ — $ —
(1) Net sales for fiscal 2007 included net sales from Scientific-Atlanta, Inc. (“Scientific-Atlanta”) of $2.8 billion for the full fiscal year while net sales for fiscal 2006 included
net sales from Scientific-Atlanta of $989 million for only the period subsequent to its acquisition in February 2006. See Note 3 to the Consolidated Financial Statements.
(2) Net income for fiscal 2007 included share-based compensation expense under Statement of Financial Accounting Standards No. 123 (revised 2004), “Share-Based
Payment,” (“SFAS 123(R)”) of $617 million, net of tax, which consisted of employee share-based compensation expense of $589 million, net of tax, and share-based
compensation expense of $28 million, net of tax, related to acquisitions and investments. Net income for fiscal 2006 included share-based compensation of $836 million,
net of tax, which consisted of employee share-based compensation expense of $756 million, net of tax, and share-based compensation expense of $80 million, net of
tax, related to acquisitions and investments. There was no employee share-based compensation expense under Statement of Financial Accounting Standards No. 123,
“Accounting for Stock-Based Compensation” (“SFAS 123”), prior to fiscal 2006 because the Company did not adopt the recognition provisions of SFAS 123. See Note 10
to the Consolidated Financial Statements.
(3) Net income for fiscal 2004 included a noncash charge for the cumulative effect of accounting change relating to share-based compensation expense of $567 million,
net of tax, related to the adoption of the Financial Accounting Standards Board (FASB) Interpretation No. 46(R), “Consolidation of Variable Interest Entities” (“FIN 46(R)”).