Cisco 2007 Annual Report Download - page 67
Download and view the complete annual report
Please find page 67 of the 2007 Cisco annual report below. You can navigate through the pages in the report by either clicking on the pages listed below, or by using the keyword search tool below to find specific information within the annual report.-
 1
1 -
2
-
3
-
4
-
5
-
6
-
7
-
8
-
9
-
10
-
11
-
12
-
13
-
14
-
15
-
16
-
17
-
18
-
19
-
20
-
21
-
22
-
23
-
24
-
25
-
26
-
27
-
28
-
29
-
30
-
31
-
32
-
33
-
34
-
35
-
36
-
37
-
38
-
39
-
40
-
41
-
42
-
43
-
44
-
45
-
46
-
47
-
48
-
49
-
50
-
51
-
52
-
53
-
54
-
55
-
56
-
 57
57 -
 58
58 -
 59
59 -
 60
60 -
 61
61 -
 62
62 -
 63
63 -
 64
64 -
 65
65 -
 66
66 -
 67
67 -
 68
68 -
 69
69 -
 70
70 -
 71
71 -
 72
72 -
 73
73 -
 74
74 -
 75
75 -
 76
76 -
 77
77 -
78
-
79
 |
 |
70 Cisco Systems, Inc.
Notes to Consolidated Financial Statements
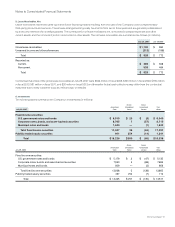
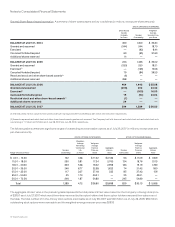
General Share-Based Award Information A summary of share-based award activity is as follows (in millions, except per-share amounts):
STOCK OPTIONS OUTSTANDING
Share-Based
Awards
Available
for Grant
Number
Outstanding
Weighted-
Average
Exercise Price
per Share
BALANCE AT JULY 31, 2004 390 1,350 $ 25.34
Granted and assumed (244) 244 18.70
Exercised — (93) 8.44
Canceled/forfeited/expired 63 (65) 31.63
Additional shares reserved 14 — —
BALANCE AT JULY 30, 2005 223 1,436 $ 25.02
Granted and assumed (230) 230 18.21
Exercised(1) — (136) 10.08
Canceled/forfeited/expired 79 (84) 29.53
Restricted stock and other share-based awards(2) (6) — —
Additional shares reserved 398 — —
BALANCE AT JULY 29, 2006 464 1,446 $ 25.08
Granted and assumed (206) 206 23.32
Exercised(1) — (309) 16.00
Canceled/forfeited/expired 19 (54) 34.04
Restricted stock and other share-based awards(2) (7) — —
Additional shares reserved 24 — —
BALANCE AT JULY 28, 2007 294 1,289 $ 26.60
(1) The total pretax intrinsic value of stock options exercised during fiscal 2007 and 2006 was $3.1 billion and $1.3 billion, respectively.
(2) Amounts represent restricted stock and other share-based awards granted and assumed. The Company had total shares of restricted stock and restricted stock units
outstanding of 11 million and 6 million as of July 28, 2007 and July 29, 2006, respectively.
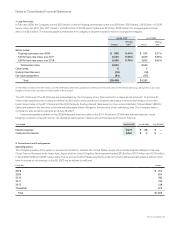
The following table summarizes significant ranges of outstanding and exercisable options as of July 28, 2007 (in millions, except years and
per-share amounts):
STOCK OPTIONS OUTSTANDING STOCK OPTIONS EXERCISABLE
Range of Exercise Prices
Number
Outstanding
Weighted-
Average
Remaining
Contractual
Life
(in Years)
Weighted-
Average
Exercise
Price per
Share
Aggregate
Intrinsic
Value
Number
Exercisable
Weighted-
Average
Exercise
Price per
Share
Aggregate
Intrinsic
Value
$ 0.01 – 15.00 122 4.58 $ 11.02 $ 2,183 93 $ 11.09 $ 1,659
15.01 – 18.00 230 5.81 17.24 2,700 124 16.76 1,513
18.01 – 20.00 303 5.48 19.22 2,958 183 19.19 1,780
20.01 – 25.00 246 6.77 22.38 1,622 74 21.42 560
25.01 – 35.00 117 3.07 27.18 235 85 27.43 156
35.01 – 50.00 25 1.70 40.01 — 25 40.01 —
50.01 – 72.56 246 1.87 54.89 — 245 54.89 —
Total 1,289 4.72 $ 26.60 $ 9,698 829 $ 30.13 $ 5,668
The aggregate intrinsic value in the preceding table represents the total pretax intrinsic value, based on the Company’s closing stock price
of $28.97 as of July 27, 2007, which would have been received by the option holders had those option holders exercised their options as of
that date. The total number of in-the-money stock options exercisable as of July 28, 2007 was 549 million. As of July 29, 2006, 969 million
outstanding stock options were exercisable and the weighted-average exercise price was $28.53.