Cisco 2007 Annual Report Download - page 23
Download and view the complete annual report
Please find page 23 of the 2007 Cisco annual report below. You can navigate through the pages in the report by either clicking on the pages listed below, or by using the keyword search tool below to find specific information within the annual report.-
 1
1 -
2
-
3
-
4
-
5
-
6
-
7
-
8
-
9
-
10
-
11
-
12
-
 13
13 -
 14
14 -
 15
15 -
 16
16 -
 17
17 -
 18
18 -
 19
19 -
 20
20 -
 21
21 -
 22
22 -
 23
23 -
 24
24 -
 25
25 -
 26
26 -
 27
27 -
 28
28 -
 29
29 -
 30
30 -
 31
31 -
 32
32 -
 33
33 -
34
-
35
-
36
-
37
-
38
-
39
-
40
-
41
-
42
-
43
-
44
-
45
-
46
-
47
-
48
-
49
-
50
-
51
-
52
-
53
-
54
-
55
-
56
-
57
-
58
-
59
-
60
-
61
-
62
-
63
-
64
-
65
-
66
-
67
-
68
-
69
-
70
-
71
-
72
-
73
-
74
-
75
-
76
-
77
-
78
-
79
 |
 |
26 Cisco Systems, Inc.
Management’s Discussion and Analysis of Financial Condition and Results of Operations
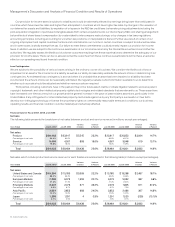
Gross Margin
The following table presents the gross margin for products and services (in millions, except percentages):
AMOUNT PERCENTAGE
Years Ended July 28, 2007 July 29, 2006 July 30, 2005 July 28, 2007 July 29, 2006 July 30, 2005
Gross margin:
Product $ 18,914 $ 15,803 $ 14,095 64.2% 66.1% 67.6%
Service 3,422 2,944 2,576 62.7% 64.5% 65.2%
Total $ 22,336 $ 18,747 $ 16,671 64.0% 65.8% 67.2%
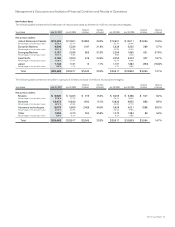
The following table presents the gross margin for each theater (in millions, except percentages):
AMOUNT PERCENTAGE
Years Ended July 28, 2007 July 29, 2006 July 30, 2005 July 28, 2007 July 29, 2006 July 30, 2005
Gross margin:
United States and Canada $ 12,414 $ 10,441 $ 8,784 64.3% 66.1% 66.1%
European Markets 4,813 4,080 3,916 65.6% 67.1% 68.8%
Emerging Markets 2,220 1,687 1,267 64.4% 68.1% 70.2%
Asia Pacific 2,281 1,870 1,671 64.2% 65.5% 67.2%
Japan 907 917 1,033 70.0% 71.0% 68.0%
Theater total 22,635 18,995 16,671 64.8% 66.7% 67.2%
Unallocated corporate items(1) (299) (248) —
Total $ 22,336 $ 18,747 $ 16,671 64.0% 65.8% 67.2%
(1) The unallocated corporate items for fiscal 2007 and 2006 primarily include the effects of amortization of purchased intangible assets and employee share-based
compensation expense. During fiscal 2007, we did not allocate these items to the gross margin for each theater because management does not use the information to
measure the performance of the operating segments. We have recast fiscal 2006 to conform to the current year’s presentation. There was no amortization of purchased
intangible assets recorded to cost of sales in fiscal 2005. In addition, there was no employee share-based compensation expense in fiscal 2005 because we did not
adopt the recognition provisions of SFAS 123.
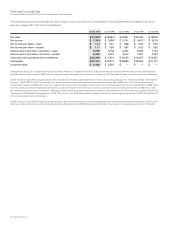
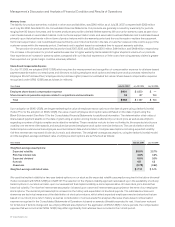
Research and Development, Sales and Marketing, and General and Administrative Expenses
Research and development (R&D), sales and marketing, and general and administrative (G&A) expenses are summarized in the following
table (in millions, except percentages):
Years Ended July 29, 2006
Variance
in Dollars
Variance
in Percent July 29, 2006 July 30, 2005
Variance
in Dollars
Variance
in PercentJuly 28, 2007
Research and development $ 4,499 $ 4,067 $ 432 10.6% $ 4,067 $ 3,322 $ 745 22.4%
Percentage of net sales 12.9% 14.3% 14.3% 13.4%
Sales and marketing 7,215 6,031 1,184 19.6% 6,031 4,721 1,310 27.7%
Percentage of net sales 20.7% 21.2% 21.2% 19.0%
General and administrative 1,513 1,169 344 29.4% 1,169 959 210 21.9%
Percentage of net sales 4.3% 4.1% 4.1% 3.9%
Total $ 13,227 $ 11,267 $ 1,960 17.4% $ 11,267 $ 9,002 $ 2,265 25.2%
Percentage of net sales 37.9% 39.6% 39.6% 36.3%
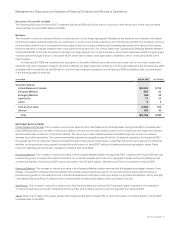
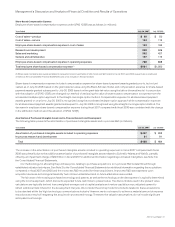
Interest and Other Income, Net
The following table presents the breakdown of interest and other income, net (in millions):
Years Ended July 29, 2006
Variance
in Dollars July 29, 2006 July 30, 2005
Variance
in DollarsJuly 28, 2007
Interest income, net $ 715 $ 607 $ 108 $ 607 $ 552 $ 55
Other income, net 125 30 95 30 68 (38)
Total $ 840 $ 637 $ 203 $ 637 $ 620 $ 17