Cisco 2007 Annual Report Download - page 24
Download and view the complete annual report
Please find page 24 of the 2007 Cisco annual report below. You can navigate through the pages in the report by either clicking on the pages listed below, or by using the keyword search tool below to find specific information within the annual report.-
 1
1 -
2
-
3
-
4
-
5
-
6
-
7
-
8
-
9
-
10
-
11
-
12
-
13
-
 14
14 -
 15
15 -
 16
16 -
 17
17 -
 18
18 -
 19
19 -
 20
20 -
 21
21 -
 22
22 -
 23
23 -
 24
24 -
 25
25 -
 26
26 -
 27
27 -
 28
28 -
 29
29 -
 30
30 -
 31
31 -
 32
32 -
 33
33 -
 34
34 -
35
-
36
-
37
-
38
-
39
-
40
-
41
-
42
-
43
-
44
-
45
-
46
-
47
-
48
-
49
-
50
-
51
-
52
-
53
-
54
-
55
-
56
-
57
-
58
-
59
-
60
-
61
-
62
-
63
-
64
-
65
-
66
-
67
-
68
-
69
-
70
-
71
-
72
-
73
-
74
-
75
-
76
-
77
-
78
-
79
 |
 |

2007 Annual Report 27
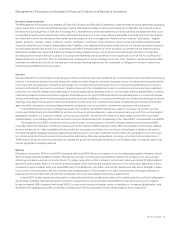
Management’s Discussion and Analysis of Financial Condition and Results of Operations
Discussion of Fiscal 2007 and 2006
The following discussion of fiscal 2007 compared with fiscal 2006 should be read in conjunction with the section of this report entitled
“Financial Data for Fiscal 2007, 2006, and 2005.”
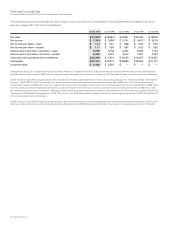
Net Sales
The increase in net product sales primarily occurred across our four largest geographic theaters as we experienced increased information
technology-related capital spending by our customers in our service provider, enterprise, and commercial markets. The increase in service
revenue was primarily due to increased technical support service contract initiations and renewals associated with higher product sales
that have resulted in a larger installed base of equipment being serviced. The United States and Canada and Emerging Markets theaters
contributed 69.6% of the total increase to net sales. The largest proportion of the increase in net product sales was related to higher sales
of advanced technologies, which contributed 44.5% of the total increase, and higher sales of switches, which contributed 29.6% of the
total increase.
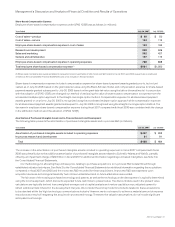
On February 24, 2006, we completed the acquisition of Scientific-Atlanta, a provider of set-top boxes, end-to-end video distribution
networks, and video integration systems. Scientific-Atlanta’s net sales reflect the contribution of Scientific-Atlanta for the full fiscal year 2007,
compared with net sales for fiscal 2006 which only included net sales subsequent to the February 2006 acquisition date, as summarized
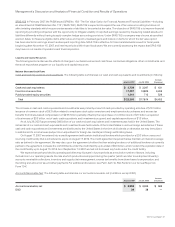
in the following table (in millions):
Years Ended July 28, 2007 July 29, 2006
Scientific-Atlanta:
United States and Canada $ 2,035 $ 756
European Markets 353 90
Emerging Markets 168 65
Asia Pacific 71 25
Japan 9 3
Total product sales 2,636 939
Service 130 50
Total $ 2,766 $ 989
Net Product Sales by Theater
United States and Canada The increase in net product sales in the United States and Canada theater during fiscal 2007 compared with
fiscal 2006 was due to an increase in net product sales in the service provider market, growth in the commercial and enterprise markets,
and the additional contribution of Scientific-Atlanta. The service provider market experienced balanced growth across our wireline,
wireless, and cable operations. The commercial market experienced growth across all of the U.S. regional operations. During fiscal 2007,
the growth rate for the enterprise market fluctuated throughout the year and was slower overall than the service provider and commercial
markets, but experienced strong growth during the fourth quarter of fiscal 2007 with good balance across all geographic areas. Sales
to the U.S. federal government also increased compared with fiscal 2006.
European Markets The increase in net product sales in the European Markets theater during fiscal 2007 compared with fiscal 2006 was due
to balanced growth in net product sales across all of our customer markets and most of our geographic areas, led by the enterprise and
commercial markets. During fiscal 2007, net product sales in the United Kingdom, Germany, and France increased from fiscal 2006.
Emerging Markets The increase in net product sales in the Emerging Markets theater represented the largest percentage increase of any
theater in fiscal 2007 compared with fiscal 2006. The increase was primarily as a result of continued network deployment by service
providers and growth in the enterprise and commercial markets as customers continue to adopt our architectural platform, led by strength
in the Middle East and Africa, Russia and the Commonwealth of Independent States (CIS), and Eastern Europe.
Asia Pacific The increase in net product sales in the Asia Pacific theater during fiscal 2007 was attributable to growth in the enterprise,
commercial, and service provider markets, with China, India, and Australia experiencing strong growth during fiscal 2007.
Japan Net product sales in the Japan theater, which represented approximately 4% of net product sales, increased slightly in fiscal 2007
compared with fiscal 2006.