Cisco 2007 Annual Report Download - page 19
Download and view the complete annual report
Please find page 19 of the 2007 Cisco annual report below. You can navigate through the pages in the report by either clicking on the pages listed below, or by using the keyword search tool below to find specific information within the annual report.-
 1
1 -
2
-
3
-
4
-
5
-
6
-
7
-
8
-
 9
9 -
 10
10 -
 11
11 -
 12
12 -
 13
13 -
 14
14 -
 15
15 -
 16
16 -
 17
17 -
 18
18 -
 19
19 -
 20
20 -
 21
21 -
 22
22 -
 23
23 -
 24
24 -
 25
25 -
 26
26 -
 27
27 -
 28
28 -
 29
29 -
30
-
31
-
32
-
33
-
34
-
35
-
36
-
37
-
38
-
39
-
40
-
41
-
42
-
43
-
44
-
45
-
46
-
47
-
48
-
49
-
50
-
51
-
52
-
53
-
54
-
55
-
56
-
57
-
58
-
59
-
60
-
61
-
62
-
63
-
64
-
65
-
66
-
67
-
68
-
69
-
70
-
71
-
72
-
73
-
74
-
75
-
76
-
77
-
78
-
79
 |
 |

22 Cisco Systems, Inc.
Management’s Discussion and Analysis of Financial Condition and Results of Operations
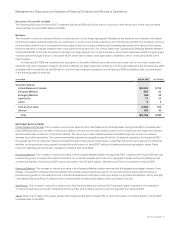
Warranty Costs
The liability for product warranties, included in other accrued liabilities, was $340 million as of July 28, 2007, compared with $309 million
as of July 29, 2006. See Note 8 to the Consolidated Financial Statements. Our products are generally covered by a warranty for periods
ranging from 90 days to five years, and for some products we provide a limited lifetime warranty. We accrue for warranty costs as part of our
cost of sales based on associated material costs, technical support labor costs, and associated overhead. Material cost is estimated based
primarily upon historical trends in the volume of product returns within the warranty period and the cost to repair or replace the equipment.
Technical support labor cost is estimated based primarily upon historical trends in the rate of customer cases and the cost to support the
customer cases within the warranty period. Overhead cost is applied based on estimated time to support warranty activities.
The provision for product warranties issued for fiscal 2007, 2006, and 2005 was $510 million, $444 million, and $449 million, respectively.
The increase in the provision for product warranties was due to higher warranty claims related to higher shipment volume of our products.
If we experience an increase in warranty claims compared with our historical experience, or if the cost of servicing warranty claims is greater
than expected, our gross margin could be adversely affected.
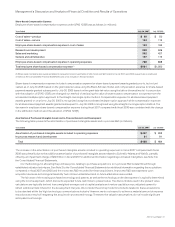
Share-Based Compensation Expense
On July 31, 2005, we adopted SFAS 123(R) which requires the measurement and recognition of compensation expense for all share-based
payment awards made to our employees and directors including employee stock options and employee stock purchases related to the
Employee Stock Purchase Plan (“employee stock purchase rights”), based on estimated fair values. Share-based compensation expense
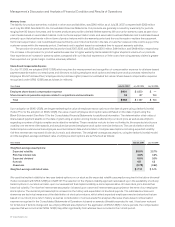
recognized under SFAS 123(R) was as follows (in millions):
Years Ended July 28, 2007 July 29, 2006 July 30, 2005
Employee share-based compensation expense $ 931 $ 1,050 $ —
Share-based compensation expense related to acquisitions and investments 34 87 154
Total $ 965 $ 1,137 $ 154
Upon adoption of SFAS 123(R), we began estimating the value of employee stock options on the date of grant using a lattice-binomial
model. Prior to the adoption of SFAS 123(R), the value of each employee stock option was estimated on the date of grant using the
Black-Scholes model. See Note 10 to the Consolidated Financial Statements for additional information. The determination of fair value of
share-based payment awards on the date of grant using an option-pricing model is affected by our stock price as well as assumptions
regarding a number of highly complex and subjective variables. These variables include, but are not limited to, the expected stock price
volatility over the term of the awards, and actual and projected employee stock option exercise behaviors. The use of a lattice-binomial
model requires extensive actual employee exercise behavior data and a number of complex assumptions including expected volatility,
risk-free interest rate, expected dividends, kurtosis, and skewness. The weighted-average assumptions, using the lattice-binomial model
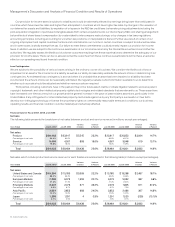
and the weighted-average estimated value of employee stock options are summarized as follows:
Years Ended July 28, 2007 July 29, 2006
Weighted-average assumptions:
Expected volatility 26.0% 23.7%
Risk-free interest rate 4.6% 4.3%
Expected dividend 0.0% 0.0%
Kurtosis 4.5 4.3
Skewness (0.79) (0.62)
Weighted-average estimated value $ 7.11 $ 5.15
We used the implied volatility for two-year traded options on our stock as the expected volatility assumption required in the lattice-binomial
model consistent with SFAS 123(R) and SAB 107. The selection of the implied volatility approach was based upon the availability of actively
traded options on our stock and also upon our assessment that implied volatility is more representative of future stock price trends than
historical volatility. The risk-free interest rate assumption is based upon observed interest rates appropriate for the term of our employee
stock options. The dividend yield assumption is based on the history and expectation of dividend payouts. The estimated kurtosis and
skewness are technical measures of the distribution of stock price returns, which affect expected employee exercise behaviors that are
based on our stock price return history as well as consideration of various academic analyses. Because share-based compensation
expense recognized in the Consolidated Statements of Operations is based on awards ultimately expected to vest, it has been reduced
for forfeitures. If factors change and we employ different assumptions in the application of SFAS 123(R) in future periods, the compensation
expense that we record under SFAS 123(R) may differ significantly from what we have recorded in the current period.