Cisco 2007 Annual Report Download - page 39
Download and view the complete annual report
Please find page 39 of the 2007 Cisco annual report below. You can navigate through the pages in the report by either clicking on the pages listed below, or by using the keyword search tool below to find specific information within the annual report.-
 1
1 -
2
-
3
-
4
-
5
-
6
-
7
-
8
-
9
-
10
-
11
-
12
-
13
-
14
-
15
-
16
-
17
-
18
-
19
-
20
-
21
-
22
-
23
-
24
-
25
-
26
-
27
-
28
-
 29
29 -
 30
30 -
 31
31 -
 32
32 -
 33
33 -
 34
34 -
 35
35 -
 36
36 -
 37
37 -
 38
38 -
 39
39 -
 40
40 -
 41
41 -
 42
42 -
 43
43 -
 44
44 -
 45
45 -
 46
46 -
 47
47 -
 48
48 -
 49
49 -
50
-
51
-
52
-
53
-
54
-
55
-
56
-
57
-
58
-
59
-
60
-
61
-
62
-
63
-
64
-
65
-
66
-
67
-
68
-
69
-
70
-
71
-
72
-
73
-
74
-
75
-
76
-
77
-
78
-
79
 |
 |

42 Cisco Systems, Inc.
Quantitative and Qualitative Disclosures About Market Risk
Investments
We maintain an investment portfolio of various holdings, types, and maturities. See Note 6 to the Consolidated Financial Statements. As of
July 28, 2007, these securities are classified as available-for-sale and consequently are recorded in the Consolidated Balance Sheets at
fair value with unrealized gains or losses, to the extent unhedged, reported as a separate component of accumulated other comprehensive
income, net of tax.
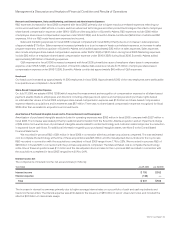
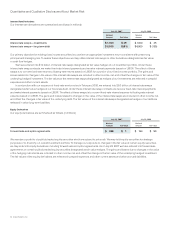
Fixed Income Securities
At any time, a sharp rise in interest rates could have a material adverse impact on the fair value of our fixed income investment portfolio.
Conversely, declines in interest rates could have a material adverse impact on interest income for our investment portfolio. Our fixed
income instruments are not leveraged as of July 28, 2007, and are held for purposes other than trading. The following table presents the
hypothetical fair values of fixed income securities, including the effects of the interest rate swaps discussed further under “Interest Rate
Derivatives” below, as a result of selected potential market decreases and increases in interest rates. Market changes reflect immediate
hypothetical parallel shifts in the yield curve of plus or minus 50 basis points (“BPS”), 100 BPS, and 150 BPS. The hypothetical fair values
as of July 28, 2007 are as follows (in millions):
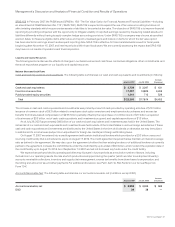
VALUATION OF SECURITIES
GIVEN AN INTEREST RATE
DECREASE OF X BASIS POINTS
FAIR VALUE
AS OF
JULY 28,
2007
VALUATION OF SECURITIES
GIVEN AN INTEREST RATE
INCREASE OF X BASIS POINTS
(150 BPS) (100 BPS) (50 BPS) 50 BPS 100 BPS 150 BPS
U.S. government notes and bonds $ 7,145 $ 7,077 $ 7,008 $ 6,940 $ 6,872 $ 6,803 $ 6,735
Corporate and municipal notes and bonds
and asset-backed securities 10,528 10,471 10,414 10,357 10,300 10,243 10,186
Total $ 17,673 $ 17,548 $ 17,422 $ 17,297 $ 17,172 $ 17,046 $ 16,921
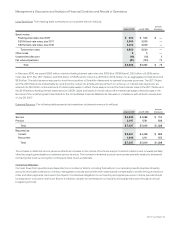
Publicly Traded Equity Securities
The values of our equity investments in several publicly traded companies are subject to market price volatility. The following table
presents the hypothetical fair values of publicly traded equity securities as a result of selected potential decreases and increases in the
price of each equity security in the portfolio, excluding hedged equity securities. Potential fluctuations in the price of each equity security
in the portfolio of plus or minus 10%, 20%, and 30% were selected based on potential near-term changes in those security prices. The
hypothetical fair values as of July 28, 2007 are as follows (in millions):
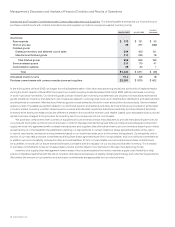
VALUATION OF SECURITIES
GIVEN AN X% DECREASE IN
EACH STOCK’S PRICE
FAIR VALUE
AS OF
JULY 28,
2007
VALUATION OF SECURITIES
GIVEN AN X% INCREASE IN
EACH STOCK’S PRICE
(30%) (20%) (10%) 10% 20% 30%
Publicly traded equity securities $ 548 $ 626 $ 705 $ 783 $ 861 $ 940 $ 1,018
Our equity portfolio consists of securities with characteristics that most closely match the Standard & Poor’s 500 Index or NASDAQ
Composite Index. These equity securities are held for purposes other than trading. There were no impairment charges on publicly traded
equity securities in fiscal 2007 or fiscal 2006 and the amount of impairment charges in fiscal 2005 was not material. The impairment
charge was related to the decline in the fair value of certain publicly traded equity securities below their cost basis that were judged to
be other-than-temporary.
Investments in Privately Held Companies
We have invested in privately held companies, some of which are in the startup or development stages. These investments are inherently
risky because the markets for the technologies or products these companies are developing are typically in the early stages and may
never materialize. We could lose our entire initial investment in these companies. These investments are primarily carried at cost, which as
of July 28, 2007 was $643 million, compared with $574 million at July 29, 2006, and are recorded in other assets. Our impairment charges
on investments in privately held companies were $22 million, $15 million, and $39 million during fiscal 2007, 2006, and 2005, respectively.
Our evaluation of investments in private and public companies is based on the fundamentals of the businesses, including, among
other factors, the nature of their technologies and potential for financial return.