Cisco 2007 Annual Report Download - page 31
Download and view the complete annual report
Please find page 31 of the 2007 Cisco annual report below. You can navigate through the pages in the report by either clicking on the pages listed below, or by using the keyword search tool below to find specific information within the annual report.-
 1
1 -
2
-
3
-
4
-
5
-
6
-
7
-
8
-
9
-
10
-
11
-
12
-
13
-
14
-
15
-
16
-
17
-
18
-
19
-
20
-
 21
21 -
 22
22 -
 23
23 -
 24
24 -
 25
25 -
 26
26 -
 27
27 -
 28
28 -
 29
29 -
 30
30 -
 31
31 -
 32
32 -
 33
33 -
 34
34 -
 35
35 -
 36
36 -
 37
37 -
 38
38 -
 39
39 -
 40
40 -
 41
41 -
42
-
43
-
44
-
45
-
46
-
47
-
48
-
49
-
50
-
51
-
52
-
53
-
54
-
55
-
56
-
57
-
58
-
59
-
60
-
61
-
62
-
63
-
64
-
65
-
66
-
67
-
68
-
69
-
70
-
71
-
72
-
73
-
74
-
75
-
76
-
77
-
78
-
79
 |
 |

34 Cisco Systems, Inc.
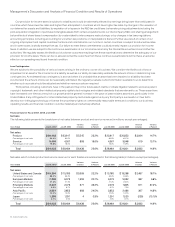
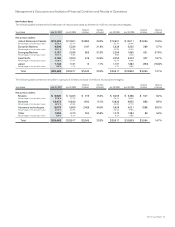
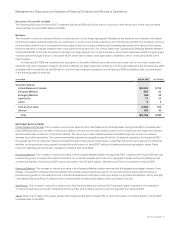
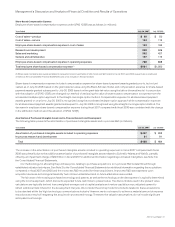
Management’s Discussion and Analysis of Financial Condition and Results of Operations
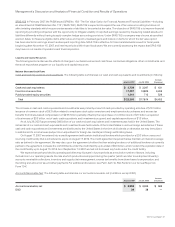
Advanced Technologies Scientific-Atlanta contributed net product sales related to advanced technologies of approximately $810 million
during fiscal 2006, which increased sales of advanced technologies by approximately 20%. Unified communications sales increased by
approximately $350 million from fiscal 2005 primarily due to sales of IP phones and associated software as our customers transitioned
from an analog-based to an IP-based infrastructure. Sales of security products increased by approximately $105 million during fiscal
2006 primarily due to module and line card sales related to our routers and LAN modular switches as customers continued to emphasize
network security. Sales of storage area networking products increased by approximately $115 million during fiscal 2006, and wireless
LAN product sales increased by approximately $135 million during fiscal 2006. Storage area networking and wireless LAN product sales
increased primarily due to new customers and continued deployments with existing customers. Home networking product sales increased
by approximately $180 million during fiscal 2006, primarily due to the acquisition of Scientific-Atlanta which contributed approximately
$115 million of home networking product sales during fiscal 2006, and the growth of our wireless and wired router businesses. Sales of
video systems products of approximately $695 million in fiscal 2006 were related to Scientific-Atlanta. Application networking services and
hosted small-business systems, which were identified as advanced technologies in the second quarter of fiscal 2006, did not represent
a significant amount of revenue for fiscal 2006.
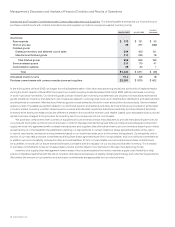
Other Product Revenue The increase in other product revenue was due to sales of our cable and IP communications solutions to service
providers, and the contribution of net product sales related to Scientific-Atlanta. We experienced weakness in optical networking sales
during fiscal 2006, with product sales increasing by approximately $5 million compared to fiscal 2005; approximately $65 million of these
sales during fiscal 2006 related to Scientific-Atlanta. Net product sales for mobile wireless products previously classified in this category
in fiscal 2005 were included in high-end router sales in fiscal 2006.
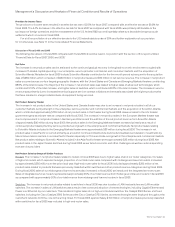
Net Service Revenue
The increase in net service revenue was primarily due to increased technical support service contract initiations and renewals associated
with higher product sales, which have resulted in a larger installed base of equipment being serviced, and revenue from advanced
services, which relates to consulting support services for our technologies for specific networking needs.
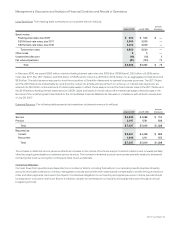
Gross Margin
The decrease in the gross margin percentage compared with fiscal 2005 was primarily related to the acquisition of Scientific-Atlanta.
Other factors contributing to the decrease in gross margin percentage were the sales mix of certain switching and routing products, and
the effect of employee share-based compensation expense under SFAS 123(R). These factors were partially offset by lower manufacturing
costs related to lower component costs and value engineering, and other manufacturing-related costs and higher volume.
Product Gross Margin
Product gross margin for fiscal 2006 included the effect of employee share-based compensation expense under SFAS 123(R), amortization
of purchased intangible assets, and inventory adjustments related to purchase accounting, which collectively reduced product gross
margin percentage by approximately 0.5%. The remaining decrease in product gross margin percentage was due to the following factors.
Changes in the mix of products sold decreased product gross margin percentage by approximately 2.5%, with 1.5% of this decrease
being related to the inclusion of net product sales from Scientific-Atlanta and the remainder being due to sales of certain switching and
routing products. Sales discounts, rebates, and product pricing decreased product gross margin percentage by approximately 1%. Lower
overall manufacturing costs related to lower component costs and value engineering and other manufacturing-related costs increased
product gross margin percentage by approximately 1%. Higher shipment volume also increased product gross margin percentage by
approximately 1.5%.
Service Gross Margin
Service gross margin for fiscal 2006 included the effect of employee share-based compensation expense under SFAS 123(R), which
reduced service gross margin percentage by approximately 2.5% compared with fiscal 2005. Our service gross margin benefited from
higher revenue on a relatively stable cost base.