Cisco 2007 Annual Report Download - page 59
Download and view the complete annual report
Please find page 59 of the 2007 Cisco annual report below. You can navigate through the pages in the report by either clicking on the pages listed below, or by using the keyword search tool below to find specific information within the annual report.-
 1
1 -
2
-
3
-
4
-
5
-
6
-
7
-
8
-
9
-
10
-
11
-
12
-
13
-
14
-
15
-
16
-
17
-
18
-
19
-
20
-
21
-
22
-
23
-
24
-
25
-
26
-
27
-
28
-
29
-
30
-
31
-
32
-
33
-
34
-
35
-
36
-
37
-
38
-
39
-
40
-
41
-
42
-
43
-
44
-
45
-
46
-
47
-
48
-
 49
49 -
 50
50 -
 51
51 -
 52
52 -
 53
53 -
 54
54 -
 55
55 -
 56
56 -
 57
57 -
 58
58 -
 59
59 -
 60
60 -
 61
61 -
 62
62 -
 63
63 -
 64
64 -
 65
65 -
 66
66 -
 67
67 -
 68
68 -
 69
69 -
70
-
71
-
72
-
73
-
74
-
75
-
76
-
77
-
78
-
79
 |
 |
62 Cisco Systems, Inc.
Notes to Consolidated Financial Statements
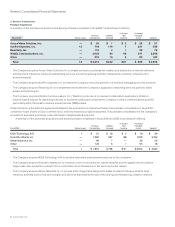
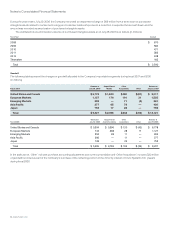
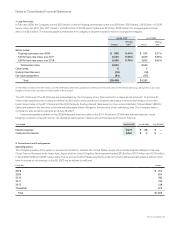
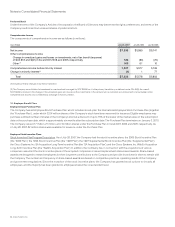
The following table presents gross realized gains and losses related to the Company’s investments (in millions):
Years Ended July 28, 2007 July 29, 2006 July 30, 2005
Gross realized gains $ 269 $ 141 $ 144
Gross realized losses (19) (88) (61)
Total $ 250 $ 53 $ 83
There were no impairment charges related to publicly traded equity securities in fiscal 2007 or fiscal 2006 and the amount of impairment
charges in fiscal 2005 was not material. The impairment charges were due to a decline in the fair value of the investments below their cost
basis that were judged to be other-than-temporary.
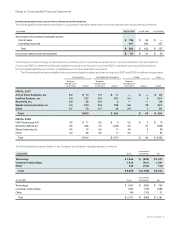
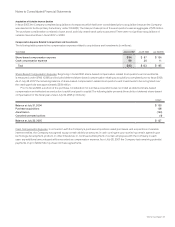
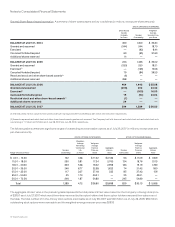
The following tables present the breakdown of the investments with unrealized losses at July 28, 2007 and July 29, 2006 (in millions):
UNREALIZED LOSSES
LESS THAN 12 MONTHS
UNREALIZED LOSSES
12 MONTHS OR GREATER TO TAL
Fair Value
Gross
Unrealized
Losses Fair Value
Gross
Unrealized
Losses Fair Value
Gross
Unrealized
LossesJuly 28, 2007
U.S. government notes and bonds $ 1,119 $ (2) $ 679 $ (6) $ 1,798 $ (8)
Corporate notes, bonds, and asset-backed securities 2,912 (19) 1,757 (38) 4,669 (57)
Municipal notes and bonds 645 (1) — — 645 (1)
Publicly traded equity securities 309 (14) — — 309 (14)
Total $ 4,985 $ (36) $ 2,436 $ (44) $ 7,421 $ (80)
UNREALIZED LOSSES
LESS THAN 12 MONTHS
UNREALIZED LOSSES
12 MONTHS OR GREATER TO TAL
Fair Value
Gross
Unrealized
Losses Fair Value
Gross
Unrealized
Losses Fair Value
Gross
Unrealized
LossesJuly 29, 2006
U.S. government notes and bonds $ 3,263 $ (33) $ 644 $ (14) $ 3,907 $ (47)
Corporate notes, bonds, and asset-backed securities 2,420 (18) 1,968 (70) 4,388 (88)
Municipal notes and bonds 146 (1) 103 (2) 249 (3)
Publicly traded equity securities 41 (6) 2 (1) 43 (7)
Total $ 5,870 $ (58) $ 2,717 $ (87) $ 8,587 $ (145)
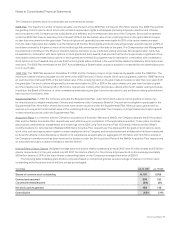
The gross unrealized losses related to fixed income securities were primarily due to changes in interest rates. The gross unrealized losses
related to publicly traded equity securities were due to changes in market prices. The Company’s management has determined that
the gross unrealized losses on its investment securities at July 28, 2007 are temporary in nature. The Company reviews its investments
to identify and evaluate investments that have indications of possible impairment. Factors considered in determining whether a loss is
temporary include the length of time and extent to which fair value has been less than the cost basis, the financial condition and near-term
prospects of the investee, and the Company’s intent and ability to hold the investment for a period of time sufficient to allow for any
anticipated recovery in market value. Substantially all of the Company’s fixed income securities are rated investment grade.
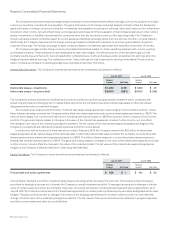
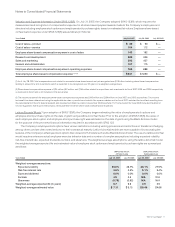
The following table summarizes the maturities of the Company’s fixed income securities at July 28, 2007 (in millions):
Amortized
Cost
Fair
Value
Less than 1 year $ 3,907 $ 3,902
Due in 1 to 2 years 3,686 3,683
Due in 2 to 5 years 7,696 7,681
Due after 5 years 2,038 2,031
Total $ 17,327 $ 17,297
Actual maturities may differ from the contractual maturities because borrowers may have the right to call or prepay certain obligations.