Cisco 2003 Annual Report Download - page 65
Download and view the complete annual report
Please find page 65 of the 2003 Cisco annual report below. You can navigate through the pages in the report by either clicking on the pages listed below, or by using the keyword search tool below to find specific information within the annual report.-
 1
1 -
2
-
3
-
4
-
5
-
6
-
7
-
8
-
9
-
10
-
11
-
12
-
13
-
14
-
15
-
16
-
17
-
18
-
19
-
20
-
21
-
22
-
23
-
24
-
25
-
26
-
27
-
28
-
29
-
30
-
31
-
32
-
33
-
34
-
35
-
36
-
37
-
38
-
39
-
40
-
41
-
42
-
43
-
44
-
45
-
46
-
47
-
48
-
49
-
50
-
51
-
52
-
53
-
54
-
 55
55 -
 56
56 -
 57
57 -
 58
58 -
 59
59 -
 60
60 -
 61
61 -
 62
62 -
 63
63 -
 64
64 -
 65
65 -
 66
66 -
 67
67 -
 68
68
 |
 |
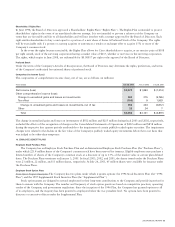
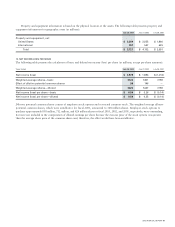
July 26, April 26, Jan. 25, Oct. 26, July 27, April 27, Jan. 26, Oct. 27,
Quarters ended 2003 2003 2003 2002 2002 2002 2002 2001
Net sales $4,702 $ 4,618 $ 4,713 $ 4,845 $4,829 $ 4,822 $ 4,816 $ 4,448
Gross margin $3,289 $ 3,269 $ 3,317 $ 3,358 $3,283 $ 3,068 $ 2,970 $ 2,692
Net income (loss) $982 $ 987 $ 991 $ 618 $772 $ 729 $ 660 $ (268)
Net income (loss) per
share—basic $0.14 $ 0.14 $ 0.14 $ 0.09 $0.11 $ 0.10 $ 0.09 $ (0.04)
Net income (loss) per
share—diluted $0.14 $ 0.14 $ 0.14 $ 0.08 $0.10 $ 0.10 $ 0.09 $ (0.04)
Cash and cash equivalents
and total investments $20,652 $20,316 $ 21,197 $ 21,188 $21,456 $ 21,061 $ 21,008 $19,080
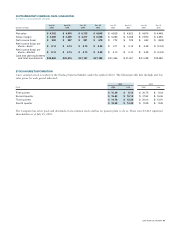
STOCK MARKET INFORMATION
Cisco common stock is traded on the Nasdaq National Market under the symbol CSCO. The following table lists the high and low
sales prices for each period indicated:
2003 2002
Fiscal High Low High Low
First quarter $15.29 $ 8.12 $20.75 $ 11.04
Second quarter $15.63 $ 10.14 $21.92 $ 16.06
Third quarter $14.78 $ 12.33 $20.00 $ 13.91
Fourth quarter $19.55 $ 14.40 $17.49 $ 11.45
The Company has never paid cash dividends on its common stock and has no present plans to do so. There were 85,041 registered
shareholders as of July 25, 2003.
2003 ANNUAL REPORT 63
SUPPLEMENTARY FINANCIAL DATA (UNAUDITED)
(In millions, except per-share amounts)