Cisco 2003 Annual Report Download - page 3
Download and view the complete annual report
Please find page 3 of the 2003 Cisco annual report below. You can navigate through the pages in the report by either clicking on the pages listed below, or by using the keyword search tool below to find specific information within the annual report.-
 1
1 -
 2
2 -
 3
3 -
 4
4 -
 5
5 -
 6
6 -
 7
7 -
 8
8 -
 9
9 -
 10
10 -
 11
11 -
 12
12 -
 13
13 -
 14
14 -
15
-
16
-
17
-
18
-
19
-
20
-
21
-
22
-
23
-
24
-
25
-
26
-
27
-
28
-
29
-
30
-
31
-
32
-
33
-
34
-
35
-
36
-
37
-
38
-
39
-
40
-
41
-
42
-
43
-
44
-
45
-
46
-
47
-
48
-
49
-
50
-
51
-
52
-
53
-
54
-
55
-
56
-
57
-
58
-
59
-
60
-
61
-
62
-
63
-
64
-
65
-
66
-
67
-
68
 |
 |

2003 ANNUAL REPORT 1
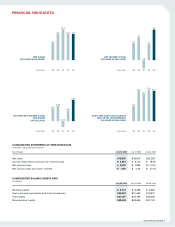
FINANCIAL HIGHLIGHTS
10.2
20.5
18.5
21.5 20.7
’99 ’00 ’01 ’02
CASH AND CASH EQUIVALENTS
AND TOTAL INVESTMENTS
(DOLLARS IN BILLIONS)
DILUTED NET INCOME (LOSS)
PER SHARE
(IN DOLLARS)
Fiscal Year
Fiscal Year
Fiscal Year
Fiscal Year
NET INCOME (LOSS)
(DOLLARS IN BILLIONS)
NET SALES
(DOLLARS IN BILLIONS)
’03
0.29
0.36
(0.14)
0.25
0.50
’99 ’00 ’01’02’03
2.0
2.7
(1.0)
1.9
3.6
’99 ’00 ’01’02’03
12.2
18.9 18.918.9
22.3
’99 ’00 ’01’02’03
CONSOLIDATED STATEMENTS OF OPERATIONS DATA
(In millions, except per-share amounts)
Years Ended July 26, 2003 July 27, 2002 July 28, 2001
Net sales $18,878 $18,915 $22,293
Income (loss) before provision for income taxes $5,013 $2,710 $ (874)
Net income (loss) $3,578 $1,893 $ (1,014)
Net income (loss) per share—diluted $0.50 $0.25 $ (0.14)
CONSOLIDATED BALANCE SHEETS DATA
(In millions)
July 26, 2003 July 27, 2002 July 28, 2001
Working capital $5,121 $9,058 $ 5,483
Cash and cash equivalents and total investments $20,652 $21,456 $ 18,517
Total assets $37,107 $37,795 $ 35,238
Shareholders’ equity $28,029 $28,656 $ 27,120