Cisco 2003 Annual Report Download - page 25
Download and view the complete annual report
Please find page 25 of the 2003 Cisco annual report below. You can navigate through the pages in the report by either clicking on the pages listed below, or by using the keyword search tool below to find specific information within the annual report.-
 1
1 -
2
-
3
-
4
-
5
-
6
-
7
-
8
-
9
-
10
-
11
-
12
-
13
-
14
-
 15
15 -
 16
16 -
 17
17 -
 18
18 -
 19
19 -
 20
20 -
 21
21 -
 22
22 -
 23
23 -
 24
24 -
 25
25 -
 26
26 -
 27
27 -
 28
28 -
 29
29 -
 30
30 -
 31
31 -
 32
32 -
 33
33 -
 34
34 -
 35
35 -
36
-
37
-
38
-
39
-
40
-
41
-
42
-
43
-
44
-
45
-
46
-
47
-
48
-
49
-
50
-
51
-
52
-
53
-
54
-
55
-
56
-
57
-
58
-
59
-
60
-
61
-
62
-
63
-
64
-
65
-
66
-
67
-
68
 |
 |

Two-tier distributors are given business terms that allow them to return a portion of inventory, receive credits for changes in
selling prices, and participate in various cooperative marketing programs. In addition, increasing two-tier distribution channels generally
results in greater difficulty in forecasting the mix of our products and, to a certain degree, the timing of orders from our customers.
We recognize revenue to two-tier distributors based on a sell-through method utilizing information provided by our distributors, and
we maintain accruals and allowances for all cooperative marketing and other programs.
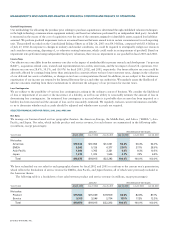
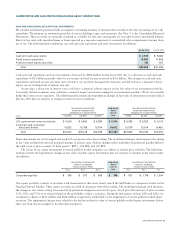
Net Service Revenue
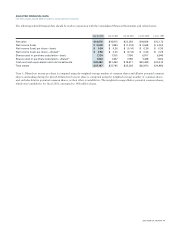
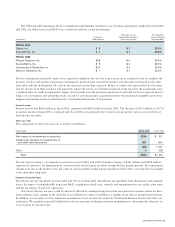
Net service revenue in fiscal 2003 increased by $67 million or 2.1% from $3.2 billion in fiscal 2002 to $3.3 billion due to increased
technical support service contract initiations and renewals associated with product sales that have resulted in a higher installed base of
equipment being serviced and revenue from advanced services, which relates to consulting support services of our technologies for
specific networking needs. Net service revenue is generally deferred and, in most cases, recognized ratably over the service period,
which is typically one to three years. Net service revenue will typically experience some variability over time due to various factors such
as the timing of technical support service contract initiations and renewals. In addition, our revenue from advanced services may
increase to a higher proportion of total service revenue due to our continued focus on providing comprehensive support of our customers’
networking devices, applications, and infrastructures.
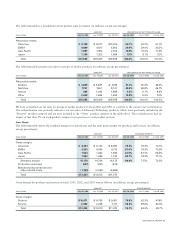
Gross Margin
Gross margin in fiscal 2003 increased from 63.5% in fiscal 2002 to 70.1% due to an increase in product gross margin partially
offset by a decrease in service gross margin as discussed below.
Product Gross Margin
Product gross margin increased from 62.3% in fiscal 2002 to 70.5% in fiscal 2003, an increase of 8.2%. This increase was due to
an increase in standard margin combined with decreases in production overhead and manufacturing and other related costs.
Standard margin increased by 3.5% in fiscal 2003, compared with fiscal 2002, due to lower component costs and value engineering,
partially offset by the impact of product pricing reductions and changes in the mix of products sold. Value engineering is the
process by which the production costs are reduced through component redesign, board configuration, test processes, and trans-
formation processes.
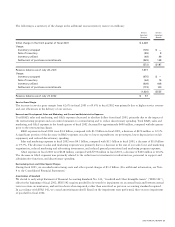
Production overhead and manufacturing and other related costs decreased in fiscal 2003, compared with fiscal 2002, which resulted
in an increase in product gross margin of 4.7%. Production overhead in fiscal 2003 decreased by $104 million from $651 million
in fiscal 2002 to $547 million related to lower labor, depreciation on equipment, and facilities charges associated with manufactur-
ing activities. In addition, manufacturing and other related costs in fiscal 2003 decreased by $652 million from $2.0 billion in fiscal
2002 to $1.4 billion due to lower warranty, provision for inventory, and other nonstandard costs. The provision for inventory in fiscal
2002 included an excess inventory benefit of $422 million related to inventory previously written off and utilized in production or sold.
Product gross margin may be adversely affected in the future by changes in the mix of products sold or channels of distribution,
sales discounts, increases in material or labor costs, excess inventory and obsolescence charges, changes in shipment volume, loss
of cost savings due to changes in component pricing, impact of value engineering, inventory holding charges, price competition and
introduction of new products or entering new markets, and different pricing and cost structures of new markets. If warranty costs
associated with our products are greater than we have experienced, product gross margin may also be adversely affected. Product
gross margin may also be affected by geographic mix, as well as the mix of configurations within each product group.
Service Gross Margin
Service gross margin decreased from 69.6% in fiscal 2002 to 68.3% in fiscal 2003, a decrease of 1.3%. Service gross margin will
typically experience some variability over time due to various factors such as the change in mix between technical support services
and advanced services, as well as the timing of technical support service contract initiations and renewals.
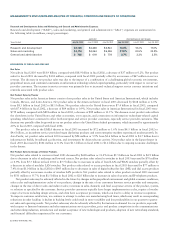
Research and Development, Sales and Marketing, and General and Administrative Expenses
R&D expenses in fiscal 2003 decreased by $313 million or 9.1% from $3.4 billion in fiscal 2002 to $3.1 billion primarily due to a
decrease in expenditures on prototypes of approximately $120 million due, in part, to our ongoing cost control measures. In addition,
the decrease in R&D expenses was also due to lower depreciation on lab equipment and other reduced discretionary spending. We have
continued to invest in R&D efforts in a wide variety of areas such as data, voice, and video over IP; advanced access and aggregation
technologies such as cable, wireless, mobility, and other broadband technologies; advanced enterprise switching; optical technology;
storage area networking; content networking; security; network management; and advanced core and edge routing technologies.
We have also continued to purchase or license technology in order to bring a broad range of products to market in a timely fashion.
If we believe that we are unable to enter a particular market in a timely manner with internally developed products, we may license
technology from other businesses or acquire businesses as an alternative to internal R&D. All of our R&D costs have been expensed
as incurred.
2003 ANNUAL REPORT 23