Cisco 2003 Annual Report Download - page 61
Download and view the complete annual report
Please find page 61 of the 2003 Cisco annual report below. You can navigate through the pages in the report by either clicking on the pages listed below, or by using the keyword search tool below to find specific information within the annual report.-
 1
1 -
2
-
3
-
4
-
5
-
6
-
7
-
8
-
9
-
10
-
11
-
12
-
13
-
14
-
15
-
16
-
17
-
18
-
19
-
20
-
21
-
22
-
23
-
24
-
25
-
26
-
27
-
28
-
29
-
30
-
31
-
32
-
33
-
34
-
35
-
36
-
37
-
38
-
39
-
40
-
41
-
42
-
43
-
44
-
45
-
46
-
47
-
48
-
49
-
50
-
 51
51 -
 52
52 -
 53
53 -
 54
54 -
 55
55 -
 56
56 -
 57
57 -
 58
58 -
 59
59 -
 60
60 -
 61
61 -
 62
62 -
 63
63 -
 64
64 -
 65
65 -
 66
66 -
 67
67 -
 68
68
 |
 |

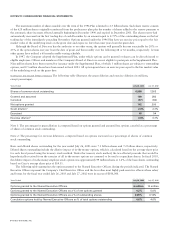
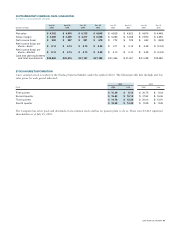
The following table presents the breakdown between current and non-current net deferred tax assets (in millions):
July 26, 2003 July 27, 2002
Current $1,975 $2,030
Non-current 1,476 1,663
Total $3,451 $3,693
The non-current portion of the deferred tax assets is included in other assets.
At July 29, 2000, the Company provided a valuation allowance on certain of its deferred tax assets because of uncertainty
regarding their realizability due to expectation of future employee stock option exercises. As of July 28, 2001, the Company had
removed the valuation allowance because it believed it was more likely than not that all deferred tax assets would be realized in the
foreseeable future and was reflected as a credit to shareholders’ equity.
As of July 26, 2003, the Company’s federal and state net operating loss carryforwards for income tax purposes were $68 million
and $22 million, respectively. If not utilized, the federal net operating loss carryforwards will begin to expire in fiscal 2010 and the
state net operating loss carryforwards will begin to expire in fiscal 2005. As of July 26, 2003, the Company’s federal and state tax
credit carryforwards for income tax purposes were $86 million and $232 million, respectively. If not utilized, the federal tax credit
carryforwards will begin to expire in fiscal 2007 and state tax credit carryforwards will begin to expire in fiscal 2005.
The Company’s income taxes payable for federal, state, and foreign purposes have been reduced, and the deferred tax assets
increased, by the tax benefits associated with dispositions of employee stock options. The Company receives an income tax benefit
calculated as the difference between the fair market value of the stock issued at the time of exercise and the option price, tax effected.
These benefits were credited directly to shareholders’ equity and amounted to $132 million, $61 million, and $1.8 billion for fiscal 2003,
2002, and 2001, respectively. Benefits reducing taxes payable amounted to $132 million, $61 million, and $1.4 billion for fiscal 2003,
2002, and 2001, respectively. Benefits increasing gross deferred tax assets amounted to $358 million in fiscal 2001.
The Company’s federal income tax returns for fiscal years ended July 25, 1998 through July 28, 2001 are under examination
and the Internal Revenue Service has proposed certain adjustments. Management believes that adequate amounts have been reserved
for any adjustments that may ultimately result from these examinations.
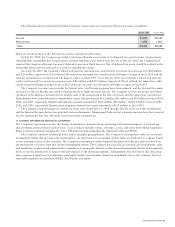
12. SEGMENT INFORMATION AND MAJOR CUSTOMERS
The Company’s operations involve the design, development, manufacturing, marketing and technical support of networking
and communications products and services. Cisco products include routers, switches, access, and other networking equipment.
These products, primarily integrated by Cisco IOS Software, link geographically dispersed LANs and WANs.
The Company conducts business globally and is managed geographically. The Company’s management relies on an internal
management system that provides sales and standard cost information by geographic theater. Sales are attributed to a theater based
on the ordering location of the customer. The Company’s management makes financial decisions and allocates resources based on
the information it receives from this internal management system. The Company does not allocate research and development, sales
and marketing, or general and administrative expenses to its geographic theaters in this internal management system, as management
does not use the information to measure the performance of the operating segments. Management does not believe that allocating
these expenses is significant in evaluating a geographic theater’s performance. Based on established criteria, the Company has four
reportable segments: the Americas, EMEA, Asia Pacific, and Japan.
2003 ANNUAL REPORT 59