Cisco 2003 Annual Report Download - page 24
Download and view the complete annual report
Please find page 24 of the 2003 Cisco annual report below. You can navigate through the pages in the report by either clicking on the pages listed below, or by using the keyword search tool below to find specific information within the annual report.-
 1
1 -
2
-
3
-
4
-
5
-
6
-
7
-
8
-
9
-
10
-
11
-
12
-
13
-
 14
14 -
 15
15 -
 16
16 -
 17
17 -
 18
18 -
 19
19 -
 20
20 -
 21
21 -
 22
22 -
 23
23 -
 24
24 -
 25
25 -
 26
26 -
 27
27 -
 28
28 -
 29
29 -
 30
30 -
 31
31 -
 32
32 -
 33
33 -
 34
34 -
35
-
36
-
37
-
38
-
39
-
40
-
41
-
42
-
43
-
44
-
45
-
46
-
47
-
48
-
49
-
50
-
51
-
52
-
53
-
54
-
55
-
56
-
57
-
58
-
59
-
60
-
61
-
62
-
63
-
64
-
65
-
66
-
67
-
68
 |
 |

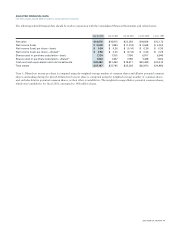
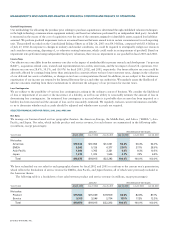
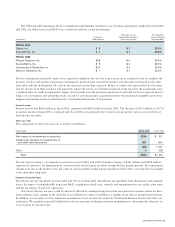
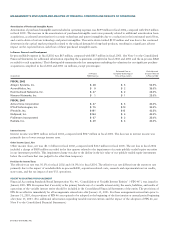
Research and Development, Sales and Marketing, and General and Administrative Expenses
Research and development (“R&D”), sales and marketing, and general and administrative (“G&A”) expenses are summarized in
the following table (in millions, except percentages):
AMOUNT PERCENTAGE OF NET SALES
Years Ended July 26, 2003 July 27, 2002 July 28, 2001 July 26, 2003 July 27, 2002 July 28, 2001
Research and development $3,135 $3,448 $3,922 16.6% 18.2% 17.6%
Sales and marketing $4,116 $4,264 $5,296 21.8% 22.5% 23.8%
General and administrative $702 $618 $778 3.7% 3.3% 3.5%
DISCUSSION OF FISCAL 2003 AND 2002
Net Sales
Net sales in fiscal 2003 were $18.9 billion, compared with $18.9 billion in fiscal 2002, a decrease of $37 million or 0.2%. Net product
sales for fiscal 2003 decreased by $104 million, compared with fiscal 2002 partially offset by an increase of $67 million in service
revenue. The decrease in net product sales was due to the impact of a combination of a challenging global economic environment,
geopolitical issues, and continued constraints on information technology-related capital spending, particularly with respect to our service
provider customers. The increase in service revenue was primarily due to increased technical support service contract initiations and
renewals associated with product sales.
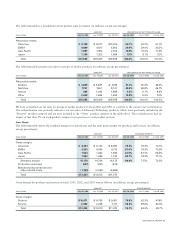
Net Product Sales by Theater
Net product sales in the Americas theater consist of net product sales in the United States and Americas International, which includes
Canada, Mexico, and Latin America. Net product sales in the Americas theater in fiscal 2003 decreased by $168 million or 2.0%
from $8.3 billion in fiscal 2002 to $8.1 billion. Net product sales in the United States were $7.4 billion in fiscal 2003, compared
with $7.4 billion in fiscal 2002, a decrease of $69 million or 0.9%. Net product sales in Americas International in fiscal 2003 were
$759 million, compared with $858 million in fiscal 2002, a decrease of $99 million or 11.5%. The decrease in net product sales reflects
the slowdown in the United States and other economies, over-capacity, and constraints on information technology-related capital
spending, which have continued to affect both enterprise and service provider customers, especially service provider customers. This
decrease was partially offset by growth in our net product sales to the United States federal government, which increased by approximately
20% in fiscal 2003 compared with fiscal 2002.
Net product sales in the EMEA theater in fiscal 2003 increased by $72 million or 1.6% from $4.5 billion in fiscal 2002 to
$4.6 billion, as incumbent service providers began deploying products and some enterprise markets experienced modest growth. In
Asia Pacific, net product sales in fiscal 2003 increased by $94 million or 5.9% from $1.6 billion in fiscal 2002 to $1.7 billion due to
infrastructure builds, broadband acceleration, and investments by Asian telecom carriers. Net product sales in the Japan theater in
fiscal 2003 decreased by $102 million or 8.1% from $1.3 billion in fiscal 2002 to $1.2 billion due to ongoing economic challenges
in the theater.
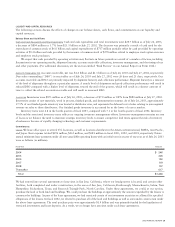
Net Product Sales by Groups of Similar Products
Net product sales related to routers in fiscal 2003 decreased by $628 million or 11.4% from $5.5 billion in fiscal 2002 to $4.9 billion
due to decreases in sales of midrange and low-end routers. Net product sales related to switches in fiscal 2003 increased by $70 million
or 0.9% from $7.7 billion in fiscal 2002 to $7.7 billion due to increases in sales of fixed LAN and WAN switches partially offset by
a decrease in sales of modular LAN switches. Net product sales related to access products in fiscal 2003 decreased by $77 million or
7.4% from $1.0 billion in fiscal 2002 to $965 million due to decreases in sales of digital subscriber line (DSL) and dial access products
partially offset by an increase in sales of wireless LAN products. Net product sales related to other products in fiscal 2003 increased
by $531 million or 35.7% from $1.5 billion in fiscal 2002 to $2.0 billion due to increases in sales of security and IP telephony products.
Net product sales may be adversely affected in the future by changes in the geopolitical environment and global economic conditions;
sales cycles and implementation cycles of our products; changes in the mix of our customers between service provider and enterprise;
changes in the mix of direct sales and indirect sales; variations in sales channels; and final acceptance criteria of the product, system,
or solution as specified by the customer. Service provider customers typically have longer implementation cycles, require a broader
range of services including design services, and often have acceptance provisions, which can lead to a delay in revenue recognition.
To improve customer satisfaction, we continue to attempt to reduce our manufacturing lead times, which may result in corresponding
reductions in order backlog. A decline in backlog levels could result in more variability and less predictability in our quarter-to-quarter
net sales and operating results. Net product sales may also be adversely affected by fluctuations in demand for our products, especially
with respect to Internet businesses and telecommunications service providers, price and product competition in the communications
and networking industries, introduction and market acceptance of new technologies and products, adoption of new networking standards,
and financial difficulties experienced by our customers.
22 CISCO SYSTEMS, INC.
MANAGEMENT’S DISCUSSION AND ANALYSIS OF FINANCIAL CONDITION AND RESULTS OF OPERATIONS