Cisco 2003 Annual Report Download - page 47
Download and view the complete annual report
Please find page 47 of the 2003 Cisco annual report below. You can navigate through the pages in the report by either clicking on the pages listed below, or by using the keyword search tool below to find specific information within the annual report.-
 1
1 -
2
-
3
-
4
-
5
-
6
-
7
-
8
-
9
-
10
-
11
-
12
-
13
-
14
-
15
-
16
-
17
-
18
-
19
-
20
-
21
-
22
-
23
-
24
-
25
-
26
-
27
-
28
-
29
-
30
-
31
-
32
-
33
-
34
-
35
-
36
-
 37
37 -
 38
38 -
 39
39 -
 40
40 -
 41
41 -
 42
42 -
 43
43 -
 44
44 -
 45
45 -
 46
46 -
 47
47 -
 48
48 -
 49
49 -
 50
50 -
 51
51 -
 52
52 -
 53
53 -
 54
54 -
 55
55 -
 56
56 -
 57
57 -
58
-
59
-
60
-
61
-
62
-
63
-
64
-
65
-
66
-
67
-
68
 |
 |

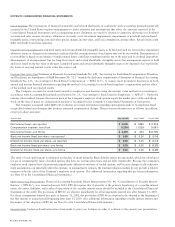
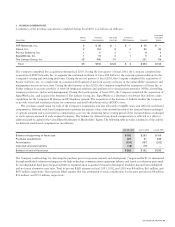
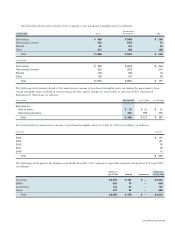
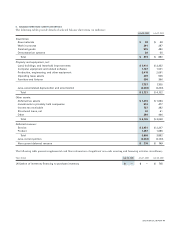
The following tables present details of the Company’s total purchased intangible assets (in millions):
Accumulated
July 26, 2003 Gross Amortization Net
Technology $639 $ (349) $ 290
Technology licenses 523 (447) 76
Patents 83 (51) 32
Other 241 (83) 158
Total $1,486 $ (930) $ 556
July 27, 2002
Technology $ 893 $ (429) $ 464
Technology licenses 523 (323) 200
Patents 128 (54) 74
Other 135 (76) 59
Total $1,679 $ (882) $ 797
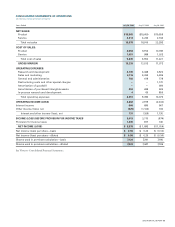
The following table presents details of the amortization expense of purchased intangible assets (excluding the impairment of pur-
chased intangible assets included in restructuring and other special charges for fiscal 2001) as reported in the Consolidated
Statements of Operations (in millions):
Years Ended July 26, 2003 July 27, 2002 July 28, 2001
Reported as:
Cost of sales $15 $22 $ 22
Operating expenses 394 699 365
Total $409 $721 $ 387
The estimated future amortization expense of purchased intangible assets as of July 26, 2003 is as follows (in millions):
Fiscal Year Amount
2004 $247
2005 181
2006 78
2007 35
2008 15
Total $556
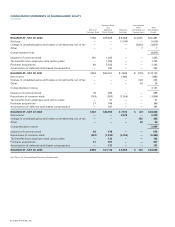
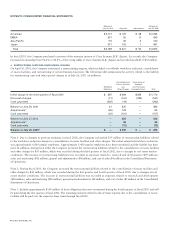
The following tables present the changes in goodwill allocated to the Company’s reportable segments during fiscal 2003 and 2002
(in millions):
Balance at Balance at
July 27, 2002 Acquired Adjustments July 26, 2003
Americas $2,335 $ 307 $ — $ 2,642
EMEA 593 75 — 668
Asia Pacific 140 27 — 167
Japan 497 69 — 566
Total $3,565 $ 478 $ — $ 4,043
2003 ANNUAL REPORT 45