Cisco 2003 Annual Report Download - page 22
Download and view the complete annual report
Please find page 22 of the 2003 Cisco annual report below. You can navigate through the pages in the report by either clicking on the pages listed below, or by using the keyword search tool below to find specific information within the annual report.-
 1
1 -
2
-
3
-
4
-
5
-
6
-
7
-
8
-
9
-
10
-
11
-
 12
12 -
 13
13 -
 14
14 -
 15
15 -
 16
16 -
 17
17 -
 18
18 -
 19
19 -
 20
20 -
 21
21 -
 22
22 -
 23
23 -
 24
24 -
 25
25 -
 26
26 -
 27
27 -
 28
28 -
 29
29 -
 30
30 -
 31
31 -
 32
32 -
33
-
34
-
35
-
36
-
37
-
38
-
39
-
40
-
41
-
42
-
43
-
44
-
45
-
46
-
47
-
48
-
49
-
50
-
51
-
52
-
53
-
54
-
55
-
56
-
57
-
58
-
59
-
60
-
61
-
62
-
63
-
64
-
65
-
66
-
67
-
68
 |
 |

Goodwill Impairments
Our methodology for allocating the purchase price relating to purchase acquisitions is determined through established valuation techniques
in the high-technology communications equipment industry and based on valuations performed by an independent third party. Goodwill
is measured as the excess of the cost of acquisition over the sum of the amounts assigned to identifiable assets acquired less liabilities
assumed. We perform goodwill impairment tests on an annual basis and between annual tests in certain circumstances for each reporting
unit. The goodwill recorded on the Consolidated Balance Sheets as of July 26, 2003 was $4.0 billion, compared with $3.6 billion as
of July 27, 2002. In response to changes in industry and market conditions, we could be required to strategically realign our resources
and consider restructuring, disposing of, or otherwise exiting businesses, which could result in an impairment of goodwill. Based on
impairment tests performed using independent third-party valuations, there was no impairment in our goodwill in fiscal 2003 and 2002.
Income Taxes
Our effective tax rates differ from the statutory rate due to the impact of nondeductible in-process research and development (“in-process
R&D”), acquisition-related costs, research and experimentation tax credits, state taxes, and the tax impact of non-U.S. operations. Our
effective tax rate was 28.6%, 30.1%, and (16.0%) for fiscal 2003, 2002, and 2001, respectively. Our future effective tax rates could be
adversely affected by earnings being lower than anticipated in countries where we have lower statutory rates, changes in the valuation
of our deferred tax assets or liabilities, or changes in tax laws or interpretations thereof. In addition, we are subject to the continuous
examination of our income tax returns by the Internal Revenue Service and other tax authorities. We regularly assess the likelihood of
adverse outcomes resulting from these examinations to determine the adequacy of our provision for income taxes.
Loss Contingencies
We are subject to the possibility of various loss contingencies arising in the ordinary course of business. We consider the likelihood
of loss or impairment of an asset or the incurrence of a liability, as well as our ability to reasonably estimate the amount of loss in
determining loss contingencies. An estimated loss contingency is accrued when it is probable that an asset has been impaired or a
liability has been incurred and the amount of loss can be reasonably estimated. We regularly evaluate current information available
to us to determine whether such accruals should be adjusted and whether new accruals are required.
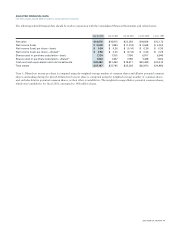
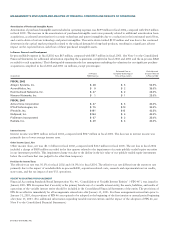
SELECTED FINANCIAL DATA FOR FISCAL 2003, 2002, AND 2001
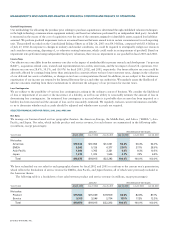
Net Sales
We manage our business based on four geographic theaters: the Americas; Europe, the Middle East, and Africa (“EMEA”); Asia
Pacific; and Japan. Net sales, which include product and service revenue, for each theater are summarized in the following table
(in millions, except percentages):
AMOUNT PERCENTAGE OF NET SALES
Years Ended July 26, 2003 July 27, 2002 July 28, 2001 July 26, 2003 July 27, 2002 July 28, 2001
Net sales:
Americas $10,544 $10,654 $12,051 55.8% 56.4% 54.0%
EMEA 5,202 5,126 6,377 27.6% 27.1% 28.6%
Asia Pacific 1,860 1,765 2,331 9.9% 9.3% 10.5%
Japan 1,272 1,370 1,534 6.7% 7.2% 6.9%
Total $18,878 $18,915 $22,293 100.0% 100.0% 100.0%
We have reclassified our net sales for each geographic theater for fiscal 2002 and 2001 to conform to the current year’s presentation,
which reflects the breakdown of service revenue for EMEA, Asia Pacific, and Japan theaters, all of which were previously included in
the Americas theater.
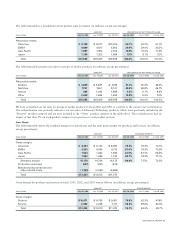
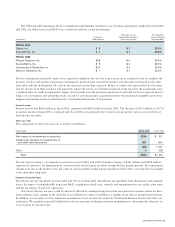
The following table is a breakdown of net sales between product and service revenue (in millions, except percentages):
AMOUNT PERCENTAGE OF NET SALES
Years Ended July 26, 2003 July 27, 2002 July 28, 2001 July 26, 2003 July 27, 2002 July 28, 2001
Net sales:
Product $15,565 $15,669 $ 19,559 82.5% 82.8% 87.7%
Service 3,313 3,246 2,734 17.5% 17.2% 12.3%
Total $18,878 $18,915 $22,293 100.0% 100.0% 100.0%
20 CISCO SYSTEMS, INC.
MANAGEMENT’S DISCUSSION AND ANALYSIS OF FINANCIAL CONDITION AND RESULTS OF OPERATIONS