Cisco 2003 Annual Report Download - page 62
Download and view the complete annual report
Please find page 62 of the 2003 Cisco annual report below. You can navigate through the pages in the report by either clicking on the pages listed below, or by using the keyword search tool below to find specific information within the annual report.-
 1
1 -
2
-
3
-
4
-
5
-
6
-
7
-
8
-
9
-
10
-
11
-
12
-
13
-
14
-
15
-
16
-
17
-
18
-
19
-
20
-
21
-
22
-
23
-
24
-
25
-
26
-
27
-
28
-
29
-
30
-
31
-
32
-
33
-
34
-
35
-
36
-
37
-
38
-
39
-
40
-
41
-
42
-
43
-
44
-
45
-
46
-
47
-
48
-
49
-
50
-
51
-
 52
52 -
 53
53 -
 54
54 -
 55
55 -
 56
56 -
 57
57 -
 58
58 -
 59
59 -
 60
60 -
 61
61 -
 62
62 -
 63
63 -
 64
64 -
 65
65 -
 66
66 -
 67
67 -
 68
68
 |
 |
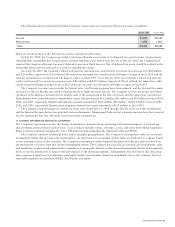
Summarized financial information by theater for fiscal 2003, 2002 and 2001, as taken from the internal management system
previously discussed, is as follows (in millions):
Years Ended July 26, 2003 July 27, 2002 July 28, 2001
Net sales:
Americas $10,544 $10,654 $12,051
EMEA 5,202 5,126 6,377
Asia Pacific 1,860 1,765 2,331
Japan 1,272 1,370 1,534
Total $18,878 $18,915 $22,293
Gross margin:
Americas $8,363 $8,122 $ 8,687
EMEA 4,232 4,066 4,710
Asia Pacific 1,523 1,432 1,594
Japan 1,052 1,086 1,182
Standard margin 15,170 14,706 16,173
Production overhead (547) (651) (615)
Manufacturing variances and other related costs (1,390) (2,042) (4,486)
Total $13,233 $12,013 $11,072
The Company has reclassified net sales for each geographic theater for fiscal 2002 and 2001 to conform to the current year’s
presentation, which reflects the breakdown of service revenue for EMEA, Asia Pacific, and Japan theaters, all of which were previously
included in the Americas theater.
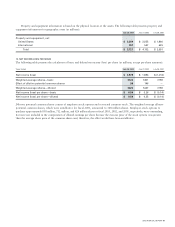
The Americas theater included non-U.S. net sales of $888 million, $988 million, and $1.1 billion for fiscal 2003, 2002, and
2001, respectively. The following table presents net sales for groups of similar products and services (in millions):
Years Ended July 26, 2003 July 27, 2002 July 28, 2001
Net sales:
Routers $4,859 $5,487 $ 7,095
Switches 7,721 7,651 9,141
Access 965 1,042 1,869
Other 2,020 1,489 1,454
Product 15,565 15,669 19,559
Service 3,313 3,246 2,734
Total $18,878 $18,915 $22,293
The Company has reclassified net sales for groups of similar products in fiscal 2002 and 2001 to conform to the current year’s
presentation. The reclassification was primarily related to net sales of Advanced Technology products, which were previously included
in the “Routers” product category and are now included in the “Other” product category in the table above. The reclassification had
an impact of less than 1% on each product category in proportion to total product revenue.
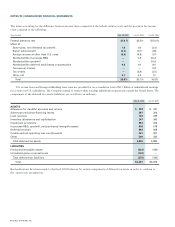
The majority of the Company’s assets as of July 26, 2003 and July 27, 2002 were attributable to its U.S. operations. In fiscal
2003, 2002, and 2001, no single customer accounted for 10% or more of the Company’s net sales.
60 CISCO SYSTEMS, INC.
NOTES TO CONSOLIDATED FINANCIAL STATEMENTS