Cisco 2003 Annual Report Download - page 35
Download and view the complete annual report
Please find page 35 of the 2003 Cisco annual report below. You can navigate through the pages in the report by either clicking on the pages listed below, or by using the keyword search tool below to find specific information within the annual report.-
 1
1 -
2
-
3
-
4
-
5
-
6
-
7
-
8
-
9
-
10
-
11
-
12
-
13
-
14
-
15
-
16
-
17
-
18
-
19
-
20
-
21
-
22
-
23
-
24
-
 25
25 -
 26
26 -
 27
27 -
 28
28 -
 29
29 -
 30
30 -
 31
31 -
 32
32 -
 33
33 -
 34
34 -
 35
35 -
 36
36 -
 37
37 -
 38
38 -
 39
39 -
 40
40 -
 41
41 -
 42
42 -
 43
43 -
 44
44 -
 45
45 -
46
-
47
-
48
-
49
-
50
-
51
-
52
-
53
-
54
-
55
-
56
-
57
-
58
-
59
-
60
-
61
-
62
-
63
-
64
-
65
-
66
-
67
-
68
 |
 |
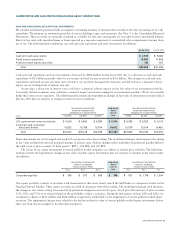
CASH AND CASH EQUIVALENTS AND TOTAL INVESTMENTS
We consider investments purchased with an original or remaining maturity of less than three months at the date of purchase to be cash
equivalents. We maintain an investment portfolio of various holdings, types, and maturities. (See Note 7 to the Consolidated Financial
Statements.) These securities are generally classified as available for sale and consequently are recorded on the Consolidated Balance
Sheets at fair value with unrealized gains or losses reported as a separate component of accumulated other comprehensive income (loss),
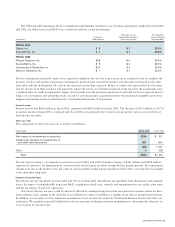
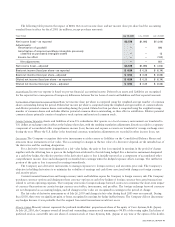
net of tax. The following table summarizes our cash and cash equivalents and total investments (in millions):
July 26, 2003 July 27, 2002
Cash and cash equivalents $3,925 $9,484
Fixed income securities 15,982 11,405
Publicly traded equity securities 745 567
Total $20,652 $21,456
Cash and cash equivalents and total investments decreased by $804 million during fiscal 2003 due to a decrease in cash and cash
equivalents of $5.6 billion partially offset by an increase in fixed income securities of $4.6 billion. The changes in cash and cash
equivalents and fixed income securities were related to our portfolio management strategies and did not have a material adverse
impact on our existing levels of interest rate risk.
At any time, a sharp rise in interest rates could have a material adverse impact on the fair value of our investment portfolio.
Conversely, declines in interest rates could have a material impact on interest earnings for our investment portfolio. We do not currently
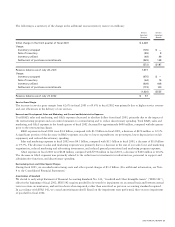
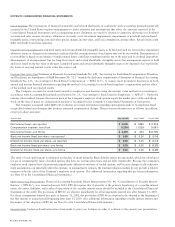
hedge these interest rate exposures. The following table presents the hypothetical changes in fair value in investment securities held at
July 26, 2003 that are sensitive to changes in interest rates (in millions):
VALUATION OF SECURITIES FAIR VALUE VALUATION OF SECURITIES
GIVEN AN INTEREST RATE AS OF GIVEN AN INTEREST RATE
DECREASE OF X BASIS POINTS JULY 26, INCREASE OF X BASIS POINTS
Issuer (150 BPS) (100 BPS) (50 BPS) 2003 50 BPS 100 BPS 150 BPS
U.S. government notes and bonds $ 5,505 $ 5,450 $ 5,395 $5,340 $5,285 $ 5,230 $ 5,175
Corporate and municipal
notes and bonds 10,832 10,768 10,704 10,642 10,578 10,514 10,450
Total $16,337 $16,218 $16,099 $15,982 $15,863 $15,744 $15,625
These instruments are not leveraged and are held for purposes other than trading. The modeling technique used measures the change
in fair value arising from selected potential changes in interest rates. Market changes reflect immediate hypothetical parallel shifts in
the yield curve of plus or minus 50 basis points (“BPS”), 100 BPS, and 150 BPS.
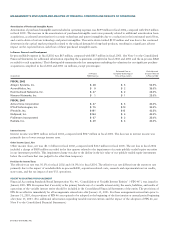
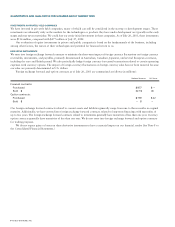
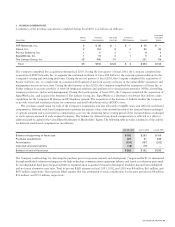
The values of our equity investments in several publicly traded companies are subject to market price volatility. The following
analysis presents the hypothetical changes in fair value of public equity investments that are sensitive to changes in the stock market
(in millions):
VALUATION OF SECURITIES FAIR VALUE VALUATION OF SECURITIES
GIVEN X% DECREASE AS OF GIVEN X% INCREASE
IN EACH STOCK'S PRICE JULY 26, IN EACH STOCK'S PRICE
(75%) (50%) (25%) 2003 25% 50% 75%
Corporate equities $ 186 $ 373 $ 559 $745 $931 $ 1,118 $ 1,304
Our equity portfolio consists of securities with characteristics that most closely match the S&P Index or companies traded on the
Nasdaq National Market. These equity securities are held for purposes other than trading. The modeling technique used measures
the change in fair values arising from selected hypothetical changes in each stock’s price. Stock price fluctuations of plus or minus
25%, 50%, and 75% were selected based on the probability of their occurrence. During the first quarter of fiscal 2003 and 2002, we
recognized a charge of $412 million and $858 million, respectively, attributable to the impairment of certain publicly traded equity
securities. The impairment charges were related to the decline in the fair value of certain publicly traded equity investments below
their cost basis that was judged to be other-than-temporary.
2003 ANNUAL REPORT 33
QUANTITATIVE AND QUALITATIVE DISCLOSURES ABOUT MARKET RISK