Cisco 2003 Annual Report Download - page 31
Download and view the complete annual report
Please find page 31 of the 2003 Cisco annual report below. You can navigate through the pages in the report by either clicking on the pages listed below, or by using the keyword search tool below to find specific information within the annual report.-
 1
1 -
2
-
3
-
4
-
5
-
6
-
7
-
8
-
9
-
10
-
11
-
12
-
13
-
14
-
15
-
16
-
17
-
18
-
19
-
20
-
 21
21 -
 22
22 -
 23
23 -
 24
24 -
 25
25 -
 26
26 -
 27
27 -
 28
28 -
 29
29 -
 30
30 -
 31
31 -
 32
32 -
 33
33 -
 34
34 -
 35
35 -
 36
36 -
 37
37 -
 38
38 -
 39
39 -
 40
40 -
 41
41 -
42
-
43
-
44
-
45
-
46
-
47
-
48
-
49
-
50
-
51
-
52
-
53
-
54
-
55
-
56
-
57
-
58
-
59
-
60
-
61
-
62
-
63
-
64
-
65
-
66
-
67
-
68
 |
 |

LIQUIDITY AND CAPITAL RESOURCES
The following sections discuss the effects of changes in our balance sheets, cash flows, and commitments on our liquidity and
capital resources.
Balance Sheet and Cash Flows
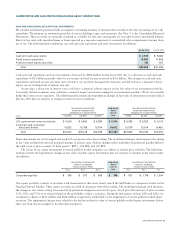
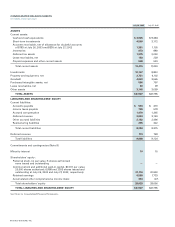
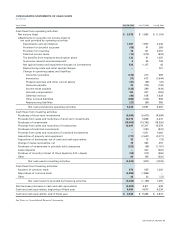
Cash and Cash Equivalents and Total Investments Cash and cash equivalents and total investments were $20.7 billion as of July 26, 2003,
a decrease of $804 million or 3.7% from $21.5 billion at July 27, 2002. The decrease was primarily a result of cash used for the
repurchase of common stock of $6.0 billion and capital expenditures of $717 million partially offset by cash provided by operating
activities of $5.2 billion and cash provided by the issuance of common stock of $578 million related to employee stock option exercises
and employee stock purchases.
We expect that cash provided by operating activities may fluctuate in future periods as a result of a number of factors, including
fluctuations in our operating results, shipment linearity, accounts receivable collections, inventory management, and the timing of tax
and other payments. (For additional discussion, see the section entitled “Risk Factors” in our Annual Report on Form 10-K.)
Accounts Receivable, Net Accounts receivable, net was $1.4 billion and $1.1 billion as of July 26, 2003 and July 27, 2002, respectively.
Days sales outstanding (“DSO”) in receivables as of July 26, 2003 and July 27, 2002 were 26 days and 21 days, respectively. Our
accounts receivable and DSO are primarily impacted by shipment linearity and collections performance. Shipment linearity is a measure
of the level of shipments throughout a particular quarter. A steady level of shipments and good collections performance will result in
reduced DSO compared with a higher level of shipments toward the end of the quarter, which will result in a shorter amount of
time to collect the related accounts receivable and will result in increased DSO.
Inventories Inventories were $873 million as of July 26, 2003, a decrease of $7.0 million or 0.8% from $880 million at July 27, 2002.
Inventories consist of raw materials, work in process, finished goods, and demonstration systems. As of July 26, 2003, approximately
37.5% of our finished goods inventory was located at distributor sites, and represents the deferred cost of sales relating to unrecognized
revenue on sales to those distributors. Our finished goods inventory is accounted for at the lower of cost or market.
Inventory turns were 6.8 in the fourth quarter of fiscal 2003, compared with 7.1 in the fourth quarter of fiscal 2002. Inventory
levels and the associated inventory turns reflect our ongoing inventory management efforts. Inventory management remains an area
of focus as we balance the need to maintain strategic inventory levels to ensure competitive lead times against the risk of inventory
obsolescence because of rapidly changing technology and customer requirements.
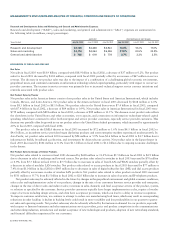
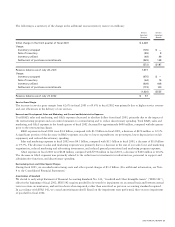
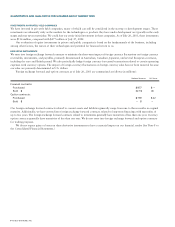
Commitments
Leases We lease office space in several U.S. locations, as well as locations elsewhere in the Americas International, EMEA, Asia Pacific,
and Japan. Rent expense totaled $196 million, $265 million, and $381 million in fiscal 2003, 2002, and 2001, respectively. Future
annual minimum lease payments under all non-cancelable operating leases with an initial term in excess of one year as of July 26, 2003
were as follows (in millions):
Fiscal Year Amount
2004 $246
2005 205
2006 152
2007 119
2008 107
Thereafter 617
Total $1,446
We had entered into several agreements to lease sites in San Jose, California, where our headquarters is located, and certain other
facilities, both completed and under construction, in the areas of San Jose, California; Boxborough, Massachusetts; Salem, New
Hampshire; Richardson, Texas; and Research Triangle Park, North Carolina. Under these agreements, we could, at our option,
purchase the land or both land and buildings. We could purchase the buildings at approximately the amount expended by the lessors to
construct the buildings. As part of the lease agreements, we had restricted certain of our investment securities as collateral for specified
obligations of the lessors. In fiscal 2002, we elected to purchase all of the land and buildings as well as sites under construction under
the above lease agreements. The total purchase price was approximately $1.9 billion and was primarily funded by the liquidation of
restricted investments and lease deposits. As a result, we no longer have any sites under such lease agreements.
2003 ANNUAL REPORT 29