Cisco 2003 Annual Report Download - page 57
Download and view the complete annual report
Please find page 57 of the 2003 Cisco annual report below. You can navigate through the pages in the report by either clicking on the pages listed below, or by using the keyword search tool below to find specific information within the annual report.-
 1
1 -
2
-
3
-
4
-
5
-
6
-
7
-
8
-
9
-
10
-
11
-
12
-
13
-
14
-
15
-
16
-
17
-
18
-
19
-
20
-
21
-
22
-
23
-
24
-
25
-
26
-
27
-
28
-
29
-
30
-
31
-
32
-
33
-
34
-
35
-
36
-
37
-
38
-
39
-
40
-
41
-
42
-
43
-
44
-
45
-
46
-
 47
47 -
 48
48 -
 49
49 -
 50
50 -
 51
51 -
 52
52 -
 53
53 -
 54
54 -
 55
55 -
 56
56 -
 57
57 -
 58
58 -
 59
59 -
 60
60 -
 61
61 -
 62
62 -
 63
63 -
 64
64 -
 65
65 -
 66
66 -
 67
67 -
68
 |
 |

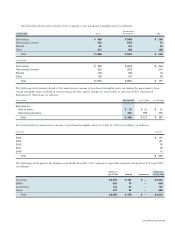
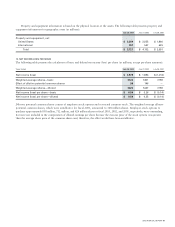
General Option Information A summary of option activity follows (in millions, except per-share amounts). The Company has, in connection
with the acquisitions of various companies, assumed the stock option plans of each acquired company. During fiscal 2003, a total of
approximately 4 million shares of the Company’s common stock has been reserved for issuance under the assumed plans and the
related options are included in the following table.
OPTIONS OUTSTANDING
Options Weighted-Average
Available Number Exercise Price
for Grant Outstanding per Share
BALANCE AT JULY 29, 2000 393 971 $ 24.19
Granted and assumed (320) 320 39.93
Exercised — (133) 7.43
Canceled 98 (98) 41.82
Additional shares reserved 351 — —
BALANCE AT JULY 28, 2001 522 1,060 29.41
Granted and assumed (282) 282 17.72
Exercised — (54) 6.99
Canceled 82 (82) 36.94
Additional shares reserved 342 — —
BALANCE AT JULY 27, 2002 664 1,206 27.17
Granted and assumed (199) 199 12.01
Exercised — (45) 7.14
Canceled 57 (57) 33.03
Additional shares reserved 4 — —
BALANCE AT JULY 26, 2003 526 1,303 $ 25.29
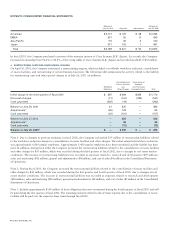
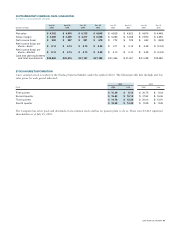
The following table summarizes significant ranges of outstanding and exercisable options as of July 26, 2003 (in millions, except
number of years and per-share amounts):
OPTIONS OUTSTANDING OPTIONS EXERCISABLE
Weighted-
Average Weighted- Weighted-
Remaining Average Average
Contractual Exercise Aggregate Exercise Aggregate
Range of Number Life Price Intrinsic Number Price Intrinsic
Exercise Prices Outstanding (In Years) per Share Value Exercisable per Share Value
$0.01 – 6.69 146 2.52 $ 4.62 $ 2,111 141 $ 4.81 $ 2,012
6.70 – 11.78 139 5.94 9.50 1,332 63 9.39 610
11.79 – 13.04 149 6.35 12.61 964 71 12.34 479
13.05 – 16.15 202 7.22 15.61 701 66 15.79 217
16.16 – 20.53 184 7.11 19.18 89 67 19.04 36
20.54 – 35.91 142 4.93 27.75 — 128 27.76 —
35.92 – 50.38 135 6.25 49.12 — 75 48.86 —
50.39 – 54.53 140 5.49 54.37 — 95 54.37 —
54.54 – 72.56 66 5.90 63.92 — 42 64.15 —
Total 1,303 5.84 $ 25.29 $5,197 748 $26.12 $3,354
The aggregate intrinsic value in the table above represents the total pre-tax intrinsic value based on Cisco’s closing stock price of
$19.08 as of July 25, 2003, that would have been received by the option holders had all option holders exercised their options as of
that date. The total number of in-the-money options exercisable as of July 26, 2003 was 382 million options. As of July 27, 2002,
634 million outstanding options were exercisable and the weighted average exercise price was $23.51.
2003 ANNUAL REPORT 55