Cisco 2003 Annual Report Download - page 27
Download and view the complete annual report
Please find page 27 of the 2003 Cisco annual report below. You can navigate through the pages in the report by either clicking on the pages listed below, or by using the keyword search tool below to find specific information within the annual report.-
 1
1 -
2
-
3
-
4
-
5
-
6
-
7
-
8
-
9
-
10
-
11
-
12
-
13
-
14
-
15
-
16
-
 17
17 -
 18
18 -
 19
19 -
 20
20 -
 21
21 -
 22
22 -
 23
23 -
 24
24 -
 25
25 -
 26
26 -
 27
27 -
 28
28 -
 29
29 -
 30
30 -
 31
31 -
 32
32 -
 33
33 -
 34
34 -
 35
35 -
 36
36 -
 37
37 -
38
-
39
-
40
-
41
-
42
-
43
-
44
-
45
-
46
-
47
-
48
-
49
-
50
-
51
-
52
-
53
-
54
-
55
-
56
-
57
-
58
-
59
-
60
-
61
-
62
-
63
-
64
-
65
-
66
-
67
-
68
 |
 |

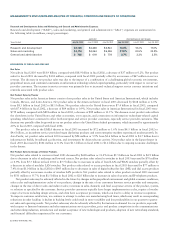
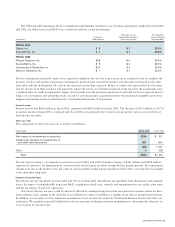
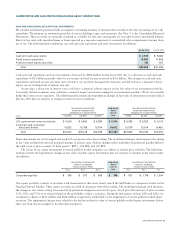
The following table summarizes the key assumptions underlying the valuation for our purchase acquisitions completed in fiscal 2003
and 2002, for which in-process R&D was recorded (in millions, except percentages):
Estimated Cost to Risk-Adjusted
In-Process Complete Technology at Discount Rate for
Acquisition R&D Expense Time of Acquisition In-Process R&D
FISCAL 2003
Okena, Inc. $3 $1 22.0%
SignalWorks, Inc. $1 $1 24.0%
FISCAL 2002
Allegro Systems, Inc. $28 $ 5 52.5%
AuroraNetics, Inc. $ 9 $ 2 35.0%
Hammerhead Networks, Inc. $27 $ 2 23.0%
Navarro Networks, Inc. $ 1 $ 1 23.0%
The key assumptions primarily consist of an expected completion date for the in-process projects; estimated costs to complete the
projects; revenue and expense projections, assuming the products have entered the market; and discount rates based on the risks
associated with the development life cycle of the in-process technology acquired. Failure to achieve the expected levels of revenue
and net income from these products will negatively impact the return on investment expected at the time that the acquisitions were
completed and may result in impairment charges. Actual results from the purchase acquisitions to date did not have a material adverse
impact on our business and operating results, except for certain purchase acquisitions where the purchased intangible assets were
impaired and written down as reflected in the Consolidated Statements of Operations.
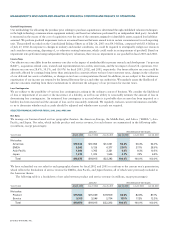
Interest Income
Interest income was $660 million in fiscal 2003, compared with $895 million in fiscal 2002. The decrease of $235 million or 26.3%
in interest income in fiscal 2003, compared with fiscal 2002, was primarily due to lower average interest rates on our portfolio of
fixed income securities.
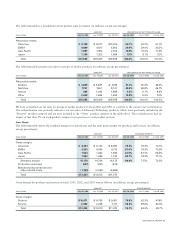
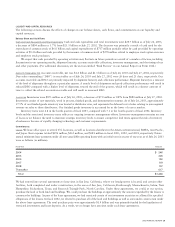
Other Loss, Net
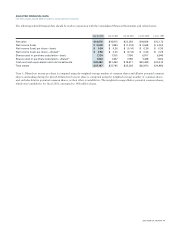
The components of other loss, net, are as follows (in millions):
Years Ended July 26, 2003 July 27, 2002
Net losses on investments in securities $239 $707
Impairment charges on investments in
privately held companies 281 420
520 1,127
Other 9(23)
Total $529 $1,104
The net losses relating to investments in securities in fiscal 2003 and 2002 included a charge of $412 million and $858 million,
respectively, related to the impairment of certain publicly traded equity securities during the first quarter periods. The impairment
charges were due to the decline in the fair value of certain publicly traded equity investments below their cost basis that was judged
to be other-than-temporary.
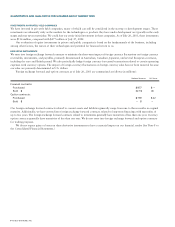
Provision for Income Taxes
The effective tax rate was 28.6% for fiscal 2003 and 30.1% for fiscal 2002. The effective tax rate differs from the statutory rate primarily
due to the impact of nondeductible in-process R&D, acquisition-related costs, research and experimentation tax credits, state taxes,
and the tax impact of non-U.S. operations.
Our future effective tax rates could be adversely affected by earnings being lower than anticipated in countries where we have
lower statutory rates, changes in the valuation of our deferred tax assets or liabilities, or changes in tax laws or interpretations thereof.
In addition, we are subject to the continuous examination of our income tax returns by the Internal Revenue Service and other tax
authorities. We regularly assess the likelihood of adverse outcomes resulting from these examinations to determine the adequacy of
our provision for income taxes.
2003 ANNUAL REPORT 25