Cisco 2003 Annual Report Download - page 23
Download and view the complete annual report
Please find page 23 of the 2003 Cisco annual report below. You can navigate through the pages in the report by either clicking on the pages listed below, or by using the keyword search tool below to find specific information within the annual report.-
 1
1 -
2
-
3
-
4
-
5
-
6
-
7
-
8
-
9
-
10
-
11
-
12
-
 13
13 -
 14
14 -
 15
15 -
 16
16 -
 17
17 -
 18
18 -
 19
19 -
 20
20 -
 21
21 -
 22
22 -
 23
23 -
 24
24 -
 25
25 -
 26
26 -
 27
27 -
 28
28 -
 29
29 -
 30
30 -
 31
31 -
 32
32 -
 33
33 -
34
-
35
-
36
-
37
-
38
-
39
-
40
-
41
-
42
-
43
-
44
-
45
-
46
-
47
-
48
-
49
-
50
-
51
-
52
-
53
-
54
-
55
-
56
-
57
-
58
-
59
-
60
-
61
-
62
-
63
-
64
-
65
-
66
-
67
-
68
 |
 |
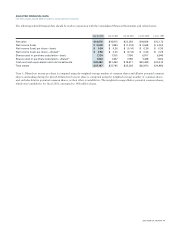
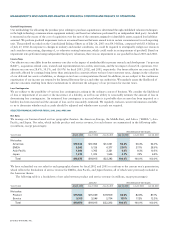
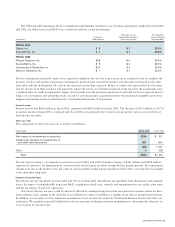
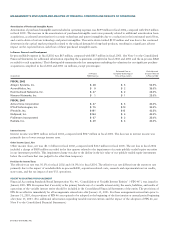
The following table is a breakdown of net product sales by theater (in millions, except percentages):
AMOUNT PERCENTAGE OF NET PRODUCT SALES
Years Ended July 26, 2003 July 27, 2002 July 28, 2001 July 26, 2003 July 27, 2002 July 28, 2001
Net product sales:
Americas $8,109 $8,277 $10,006 52.1% 52.7% 51.1%
EMEA 4,609 4,537 5,902 29.6% 29.0% 30.2%
Asia Pacific 1,687 1,593 2,193 10.8% 10.2% 11.2%
Japan 1,160 1,262 1,458 7.5% 8.1% 7.5%
Total $15,565 $15,669 $19,559 100.0% 100.0% 100.0%
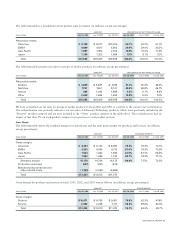
The following table presents net sales for groups of similar products (in millions, except percentages):
AMOUNT PERCENTAGE OF NET PRODUCT SALES
Years Ended July 26, 2003 July 27, 2002 July 28, 2001 July 26, 2003 July 27, 2002 July 28, 2001
Net product sales:
Routers $4,859 $5,487 $ 7,095 31.2% 35.0% 36.3%
Switches 7,721 7,651 9,141 49.6% 48.8% 46.7%
Access 965 1,042 1,869 6.2% 6.7% 9.6%
Other 2,020 1,489 1,454 13.0% 9.5% 7.4%
Total $15,565 $15,669 $19,559 100.0% 100.0% 100.0%
We have reclassified our net sales for groups of similar products in fiscal 2002 and 2001 to conform to the current year’s presentation.
The reclassification was primarily related to our net sales of Advanced Technology products, which were previously included in the
“Routers” product category and are now included in the “Other” product category in the table above. The reclassification had an
impact of less than 1% on each product category in proportion to total product revenue.
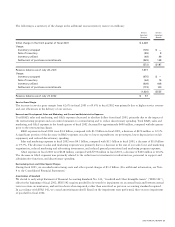
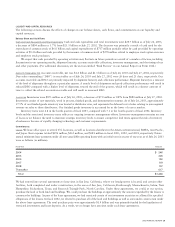
Gross Margin
The following table shows the standard margin for each theater and the total gross margin for products and services (in millions,
except percentages):
AMOUNT STANDARD MARGIN
Years Ended July 26, 2003 July 27, 2002 July 28, 2001 July 26, 2003 July 27, 2002 July 28, 2001
Gross margin:
Americas $8,363 $8,122 $ 8,687 79.3% 76.2% 72.1%
EMEA 4,232 4,066 4,710 81.4% 79.3% 73.9%
Asia Pacific 1,523 1,432 1,594 81.9% 81.1% 68.4%
Japan 1,052 1,086 1,182 82.7% 79.3% 77.1%
Standard margin 15,170 14,706 16,173 80.4% 77.7% 72.5%
Production overhead (547) (651) (615)
Manufacturing variances and
other related costs (1,390) (2,042) (4,486)
Total $13,233 $12,013 $11,072
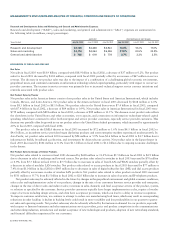
Gross margin for products and services in fiscal 2003, 2002, and 2001 was as follows (in millions, except percentages):
AMOUNT GROSS MARGIN
Years Ended July 26, 2003 July 27, 2002 July 28, 2001 July 26, 2003 July 27, 2002 July 28, 2001
Gross margin:
Product $10,971 $9,755 $ 9,361 70.5% 62.3% 47.9%
Service 2,262 2,258 1,711 68.3% 69.6% 62.6%
Total $13,233 $12,013 $11,072 70.1% 63.5% 49.7%
2003 ANNUAL REPORT 21