Cisco 2003 Annual Report Download - page 50
Download and view the complete annual report
Please find page 50 of the 2003 Cisco annual report below. You can navigate through the pages in the report by either clicking on the pages listed below, or by using the keyword search tool below to find specific information within the annual report.-
 1
1 -
2
-
3
-
4
-
5
-
6
-
7
-
8
-
9
-
10
-
11
-
12
-
13
-
14
-
15
-
16
-
17
-
18
-
19
-
20
-
21
-
22
-
23
-
24
-
25
-
26
-
27
-
28
-
29
-
30
-
31
-
32
-
33
-
34
-
35
-
36
-
37
-
38
-
39
-
 40
40 -
 41
41 -
 42
42 -
 43
43 -
 44
44 -
 45
45 -
 46
46 -
 47
47 -
 48
48 -
 49
49 -
 50
50 -
 51
51 -
 52
52 -
 53
53 -
 54
54 -
 55
55 -
 56
56 -
 57
57 -
 58
58 -
 59
59 -
 60
60 -
61
-
62
-
63
-
64
-
65
-
66
-
67
-
68
 |
 |
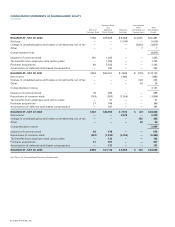
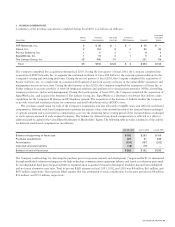
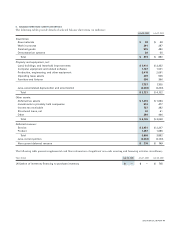
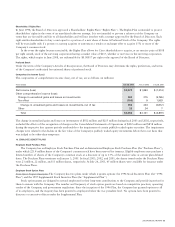
6. LEASE RECEIVABLES, NET
Lease receivables represent sales-type and direct-financing leases resulting from the sale of the Company’s and complementary third-
party products and services. These lease arrangements typically have terms from two to three years and are usually collateralized by
a security interest in the underlying assets. The net lease receivables are summarized as follows (in millions):
July 26, 2003 July 27, 2002
Gross lease receivables $747 $1,214
Unearned income and other reserves (524) (936)
Total 223 278
Less, current portion (163) (239)
Non-current lease receivables, net $60 $39
Contractual maturities of the gross lease receivables at July 26, 2003 were $316 million in fiscal 2004, $317 million in fiscal 2005,
$96 million in fiscal 2006, $12 million in fiscal 2007, and $6 million in fiscal 2008. Actual cash collections may differ from the
contractual maturities due to early customer buyouts or refinancings.
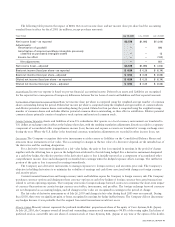
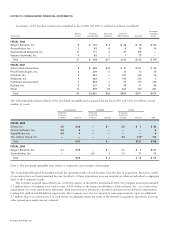
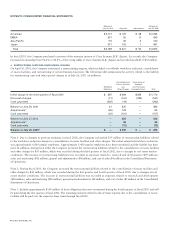
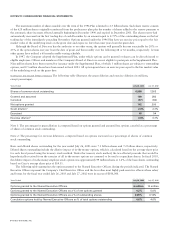
7. INVESTMENTS
The following tables summarize the Company’s investments (in millions):
Gross Gross
Amortized Unrealized Unrealized Fair
July 26, 2003 Cost Gains Losses Value
U.S. government notes and bonds $5,302 $ 68 $ (30) $ 5,340
Corporate notes and bonds 9,978 152 (10) 10,120
Municipal notes and bonds 522 — — 522
Corporate equity securities 467 278 — 745
Total $16,269 $ 498 $ (40) $16,727
Reported as:
Short-term investments $4,560
Investments 12,167
Total $16,727
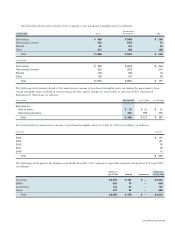
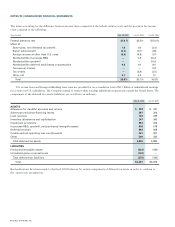
Gross Gross
Amortized Unrealized Unrealized Fair
July 27, 2002 Cost Gains Losses Value
U.S. government notes and bonds $ 4,346 $ 122 $ (1) $ 4,467
Corporate notes and bonds 6,819 127 (8) 6,938
Corporate equity securities 851 71 (355) 567
Total $12,016 $ 320 $ (364) $11,972
Reported as:
Short-term investments $3,172
Investments 8,800
Total $11,972
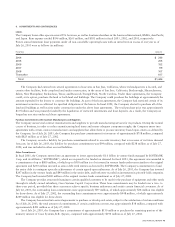
The following table summarizes the maturities of the Company’s notes and bond investments at July 26, 2003 (in millions):
Amortized Fair
Cost Value
Less than one year $4,547 $ 4,560
Due in 1-2 years 2,921 2,963
Due in 2-5 years 4,664 4,749
Due after 5 years 3,670 3,710
Total $15,802 $15,982
48 CISCO SYSTEMS, INC.
NOTES TO CONSOLIDATED FINANCIAL STATEMENTS