Cisco 2003 Annual Report Download - page 26
Download and view the complete annual report
Please find page 26 of the 2003 Cisco annual report below. You can navigate through the pages in the report by either clicking on the pages listed below, or by using the keyword search tool below to find specific information within the annual report.-
 1
1 -
2
-
3
-
4
-
5
-
6
-
7
-
8
-
9
-
10
-
11
-
12
-
13
-
14
-
15
-
 16
16 -
 17
17 -
 18
18 -
 19
19 -
 20
20 -
 21
21 -
 22
22 -
 23
23 -
 24
24 -
 25
25 -
 26
26 -
 27
27 -
 28
28 -
 29
29 -
 30
30 -
 31
31 -
 32
32 -
 33
33 -
 34
34 -
 35
35 -
 36
36 -
37
-
38
-
39
-
40
-
41
-
42
-
43
-
44
-
45
-
46
-
47
-
48
-
49
-
50
-
51
-
52
-
53
-
54
-
55
-
56
-
57
-
58
-
59
-
60
-
61
-
62
-
63
-
64
-
65
-
66
-
67
-
68
 |
 |

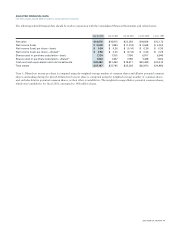
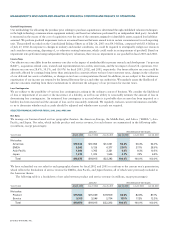
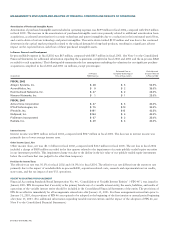
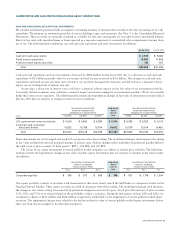
Sales and marketing expenses in fiscal 2003 decreased by $148 million or 3.5% from $4.3 billion in fiscal 2002 to $4.1 billion
due to a decrease in sales expenses of $176 million partially offset by an increase in marketing expenses of $28 million. Sales expenses
decreased in fiscal 2003, compared with fiscal 2002, due to the decrease in expenses related to our sales programs and other reduced
discretionary spending. In addition, we experienced a decrease in the size of our sales force during fiscal 2003. Our marketing expenses
increased in fiscal 2003, compared with fiscal 2002, as we have continued to invest in both our new growth market opportunities and
our branding strategy. During fiscal 2003, we invested approximately $98 million in a new marketing campaign.
G&A expenses in fiscal 2003 increased by $84 million or 13.6% from $618 million in fiscal 2002 to $702 million. The increase
in G&A expenses for fiscal 2003, compared with fiscal 2002, was primarily related to real estate allocations.
We hedge foreign currency forecasted transactions related to operating expenses with currency options. The effects of foreign currency
fluctuations, net of hedging, increased total R&D, sales and marketing, and G&A expenses by approximately 1% in fiscal 2003
compared with fiscal 2002.
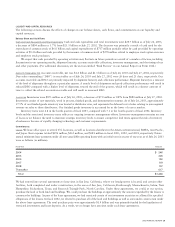
In the third quarter of fiscal 2001, we announced a restructuring program to prioritize our initiatives around a focus on profit
contribution, high-growth areas of our business, reduction of expenses, and improved efficiency. This restructuring program included a
worldwide workforce reduction, consolidation of excess facilities, and restructuring of certain business functions. (For additional
information regarding the restructuring program, see Note 4 to the Consolidated Financial Statements.) During fiscal 2003, we increased
the restructuring liabilities related to the consolidation of excess facilities and other charges by $45 million, which was recorded during
the first and fourth quarter of fiscal 2003, due to changes in real estate market conditions. The increase in restructuring liabilities was
recorded as expenses related to R&D ($18 million), sales and marketing ($18 million), G&A ($4 million), and cost of sales ($5 million)
in the Consolidated Statements of Operations. During fiscal 2002, we increased the restructuring liabilities related to the consolidation
of excess facilities and other charges by $93 million, which was recorded in the third quarter of fiscal 2002, due to changes in real
estate market conditions. The increase in restructuring liabilities was recorded as expenses related to R&D ($39 million), sales and
marketing ($42 million), G&A ($8 million), and cost of sales ($4 million) in the Consolidated Statements of Operations. There can
be no assurance that future changes in real estate market conditions will not result in additional real estate liabilities.
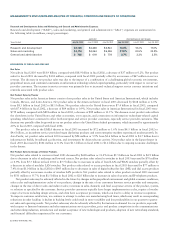
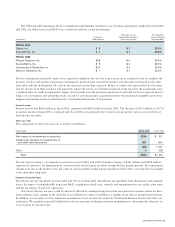
Amortization of Purchased Intangible Assets
Amortization of purchased intangible assets included in operating expenses was $394 million in fiscal 2003, compared with $699 million
in fiscal 2002. The decrease in the amortization of purchased intangible assets in fiscal 2003, compared with fiscal 2002, was primarily
due to the accelerated amortization for certain technology and patent intangibles in the prior year period, and a decrease in the
write-down of certain technology and patent intangibles. The write-down of certain technology and patent intangibles in fiscal 2003
was $49 million, compared with $159 million in fiscal 2002. The write-downs of certain technology and patent intangibles were related
to a decrease in the expected future cash flows for these purchased intangible assets. (For additional information regarding purchased
intangible assets, see Note 3 to the Consolidated Financial Statements.)
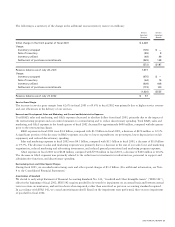
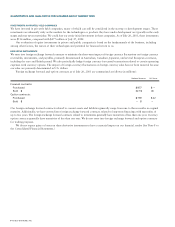
In-Process Research and Development
Our methodology for allocating the purchase price relating to purchase acquisitions to in-process R&D is determined through established
valuation techniques in the high-technology communications equipment industry and based on valuations performed by an independent
third party. In-process R&D expense in fiscal 2003 was $4 million, compared with $65 million in fiscal 2002. (See Note 3 to the
Consolidated Financial Statements for additional information regarding the acquisitions completed in fiscal 2003 and 2002 and the
in-process R&D recorded for each acquisition.) The amount expensed to in-process R&D was expensed upon acquisition because
technological feasibility had not been established and no future alternative uses existed.
The fair value of the existing purchased technology and patents, as well as the technology under development, is determined using the
income approach, which discounts expected future cash flows to present value. The discount rates used in the present value calculations
are typically derived from a weighted-average cost of capital analysis and venture capital surveys, adjusted upward to reflect additional
risks inherent in the development life cycle. We consider the pricing model for products related to these acquisitions to be standard
within the high-technology communications equipment industry. However, we do not expect to achieve a material amount of expense
reductions as a result of integrating the acquired in-process technology. Therefore, the valuation assumptions do not include significant
anticipated cost savings.
For purchase acquisitions completed to date, the development of these technologies remains a significant risk due to the remaining
efforts to achieve technical viability, rapidly changing customer markets, uncertain standards for new products, and significant
competitive threats from several companies. The nature of the efforts to develop these technologies into commercially viable products
consists primarily of planning, designing, experimenting, and testing activities necessary to determine that the technologies can meet
market expectations, including functionality and technical requirements. Failure to bring these products to market in a timely manner
could result in a loss of market share or a lost opportunity to capitalize on emerging markets, and could have a material adverse impact
on our business and operating results.
24 CISCO SYSTEMS, INC.
MANAGEMENT’S DISCUSSION AND ANALYSIS OF FINANCIAL CONDITION AND RESULTS OF OPERATIONS