Cisco 2003 Annual Report Download - page 29
Download and view the complete annual report
Please find page 29 of the 2003 Cisco annual report below. You can navigate through the pages in the report by either clicking on the pages listed below, or by using the keyword search tool below to find specific information within the annual report.-
 1
1 -
2
-
3
-
4
-
5
-
6
-
7
-
8
-
9
-
10
-
11
-
12
-
13
-
14
-
15
-
16
-
17
-
18
-
 19
19 -
 20
20 -
 21
21 -
 22
22 -
 23
23 -
 24
24 -
 25
25 -
 26
26 -
 27
27 -
 28
28 -
 29
29 -
 30
30 -
 31
31 -
 32
32 -
 33
33 -
 34
34 -
 35
35 -
 36
36 -
 37
37 -
 38
38 -
 39
39 -
40
-
41
-
42
-
43
-
44
-
45
-
46
-
47
-
48
-
49
-
50
-
51
-
52
-
53
-
54
-
55
-
56
-
57
-
58
-
59
-
60
-
61
-
62
-
63
-
64
-
65
-
66
-
67
-
68
 |
 |

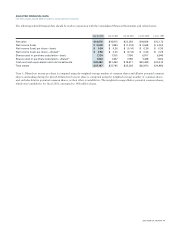
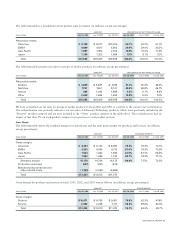
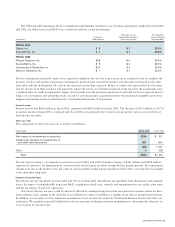
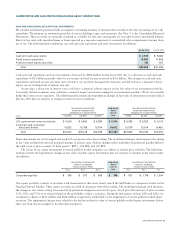
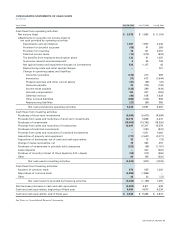
The following is a summary of the change in the additional excess inventory reserve (in millions):
Excess Excess
Inventory Inventory
Reserve Benefit
Initial charge in the third quarter of fiscal 2001 $ 2,249
Usage:
Inventory scrapped (105) $ —
Sale of inventory (89) 9
Inventory utilized (49) 49
Settlement of purchase commitments (329) 129
(572) $ 187
Reserve balance as of July 28, 2001 1,677
Usage:
Inventory scrapped (975) $ —
Sale of inventory (64) 14
Inventory utilized (408) 408
Settlement of purchase commitments (173) 103
(1,620) $ 525
Reserve balance as of July 27, 2002 $57
Service Gross Margin
The increase in service gross margin from 62.6% in fiscal 2001 to 69.6% in fiscal 2002 was primarily due to higher service revenue
and cost efficiencies in the delivery of our services.
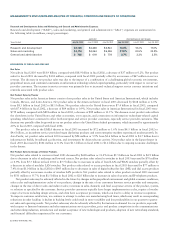
Research and Development, Sales and Marketing, and General and Administrative Expenses
Total R&D, sales and marketing, and G&A expenses decreased in absolute dollars from fiscal 2001, primarily due to the impact of
the restructuring program and cost control measures to contain hiring and to reduce discretionary spending. Total R&D, sales and
marketing, and G&A expenses in the fourth quarter of fiscal 2002 decreased by approximately $600 million, compared with the quarter
prior to the restructuring charge.
R&D expenses in fiscal 2002 were $3.4 billion, compared with $3.9 billion in fiscal 2001, a decrease of $474 million or 12.1%.
A significant portion of the decrease in R&D expenses was due to lower expenditures on prototypes, lower depreciation on lab
equipment, and reduced discretionary spending.
Sales and marketing expenses in fiscal 2002 were $4.3 billion, compared with $5.3 billion in fiscal 2001, a decrease of $1.0 billion
or 19.5%. The decrease in sales and marketing expenses was primarily due to a decrease in the size of our sales force and marketing
organization, reduced marketing and advertising investments, and reduced general promotional and marketing program expenses.
G&A expenses in fiscal 2002 were $618 million, compared with $778 million in fiscal 2001, a decrease of $160 million or 20.6%.
The decrease in G&A expenses was primarily related to the reductions in investments in infrastructure, personnel in support and
administrative functions, and discretionary spending.
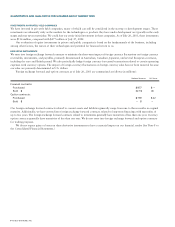
Restructuring Costs and Other Special Charges
During fiscal 2001, we recorded restructuring costs and other special charges of $1.2 billion. (For additional information, see Note
4 to the Consolidated Financial Statements.)
Amortization of Goodwill
We elected to early adopt Statement of Financial Accounting Standards No. 142, “Goodwill and Other Intangible Assets” (“SFAS 142”),
effective the beginning of fiscal 2002. SFAS 142 requires goodwill to be tested for impairment on an annual basis and between annual
tests in certain circumstances, and written down when impaired, rather than amortized as previous accounting standards required.
In accordance with SFAS 142, we ceased amortizing goodwill. Based on the impairment tests performed, there was no impairment
of goodwill in fiscal 2002.
2003 ANNUAL REPORT 27