Cisco 2003 Annual Report Download - page 19
Download and view the complete annual report
Please find page 19 of the 2003 Cisco annual report below. You can navigate through the pages in the report by either clicking on the pages listed below, or by using the keyword search tool below to find specific information within the annual report.-
 1
1 -
2
-
3
-
4
-
5
-
6
-
7
-
8
-
 9
9 -
 10
10 -
 11
11 -
 12
12 -
 13
13 -
 14
14 -
 15
15 -
 16
16 -
 17
17 -
 18
18 -
 19
19 -
 20
20 -
 21
21 -
 22
22 -
 23
23 -
 24
24 -
 25
25 -
 26
26 -
 27
27 -
 28
28 -
 29
29 -
30
-
31
-
32
-
33
-
34
-
35
-
36
-
37
-
38
-
39
-
40
-
41
-
42
-
43
-
44
-
45
-
46
-
47
-
48
-
49
-
50
-
51
-
52
-
53
-
54
-
55
-
56
-
57
-
58
-
59
-
60
-
61
-
62
-
63
-
64
-
65
-
66
-
67
-
68
 |
 |

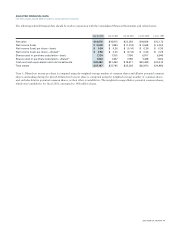
The following selected financial data should be read in conjunction with the Consolidated Financial Statements and related notes.
July 26, 2003 July 27, 2002 July 28, 2001 July 29, 2000 July 31, 1999
Net sales $18,878 $18,915 $22,293 $18,928 $12,173
Net income (loss) $3,578 $1,893 $ (1,014) $ 2,668 $ 2,023
Net income (loss) per share—basic $0.50 $0.26 $ (0.14) $ 0.39 $ 0.30
Net income (loss) per share—diluted(1) $0.50 $0.25 $ (0.14) $ 0.36 $ 0.29
Shares used in per-share calculation—basic 7,124 7,301 7,196 6,917 6,646
Shares used in per-share calculation—diluted(1) 7,223 7,447 7,196 7,438 7,062
Cash and cash equivalents and total investments $20,652 $21,456 $ 18,517 $20,499 $10,214
Total assets $37,107 $37, 795 $35,238 $32,870 $14,893
Note 1: Diluted net income per share is computed using the weighted-average number of common shares and dilutive potential common
shares outstanding during the period. Diluted net loss per share is computed using the weighted-average number of common shares
and excludes dilutive potential common shares, as their effect is antidilutive. The weighted-average dilutive potential common shares,
which were antidilutive for fiscal 2001, amounted to 348 million shares.
2003 ANNUAL REPORT 17
SELECTED FINANCIAL DATA
Five Years Ended July 26, 2003 (In millions, except per-share amounts)