Capital One 1996 Annual Report Download - page 55
Download and view the complete annual report
Please find page 55 of the 1996 Capital One annual report below. You can navigate through the pages in the report by either clicking on the pages listed below, or by using the keyword search tool below to find specific information within the annual report.-
 1
1 -
2
-
3
-
4
-
5
-
6
-
7
-
8
-
9
-
10
-
11
-
12
-
13
-
14
-
15
-
16
-
17
-
18
-
19
-
20
-
21
-
22
-
23
-
24
-
25
-
26
-
27
-
28
-
29
-
30
-
31
-
32
-
33
-
34
-
35
-
36
-
37
-
38
-
39
-
40
-
41
-
42
-
43
-
44
-
 45
45 -
 46
46 -
 47
47 -
 48
48 -
 49
49 -
 50
50 -
 51
51 -
 52
52 -
 53
53 -
 54
54 -
 55
55 -
 56
56 -
 57
57 -
 58
58 -
 59
59
 |
 |

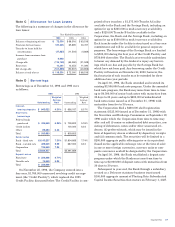
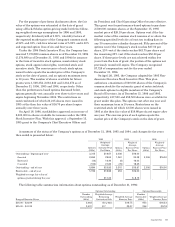
Note L Securitizations
The Company securitized $2,695,000 and $3,525,000 of
credit card receivables in 1996 and 1995, respectively, and
had $8,460,607 of investors’ undivided interests in the
receivables under securitizations outstanding as of
December 31, 1996, with expected maturities from 1997 to
2001 (extendable to 2004). The income from securitizations
is included in credit card servicing income.
The Company has entered into swaps to reduce the
interest rate sensitivity associated with these securitiza-
tions. In 1995, the Company entered into swaps with
notional amounts totaling $591,000 which are scheduled to
mature in 1998 and 1999 to coincide with the final pay-
ment date of a 1995 securitization. In 1994, the Company
entered into swaps with notional amounts totaling
$539,000 which are scheduled to mature in 1997 to coincide
with the final payment date of the remaining term of a
1993 securitization. These swaps paid floating rates of
three-month LIBOR (weighted average contractual rate of
5.55% and 5.78% as of December 31, 1996 and 1995,
respectively) and received a weighted average fixed rate of
7.23% as of December 31, 1996 and 1995.
The terms of securitizations require the Company to
maintain a certain level of assets, retained by the trust, to
absorb potential credit losses. The amount available to
absorb potential credit losses was included in accounts
receivable from securitizations and was $266,813 and
$235,188 as of December 31, 1996 and 1995, respectively.
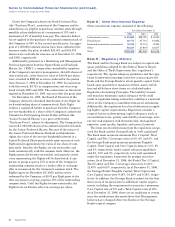
Note M Significant Concentration
of Credit Risk
The Company is active in originating consumer loans pri-
marily in the United States. The Company reviews each
potential customer’s credit application and evaluates the
applicant’s financial history and ability and willingness to
repay. Loans are made primarily on an unsecured basis;
however, certain loans require collateral in the form of cash
deposits.
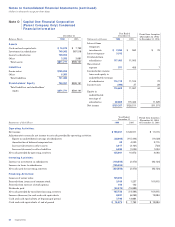
The geographic distribution of the Company’s consumer
loans was as follows:
Year Ended December 31
1996 1995
Loans % Loans %
Geographic
Region:
Northeast $ 2,465,237 19.25% $ 2,010,326 19.25%
South 4,615,596 36.05 3,777,644 36.17
Midwest 2,386,918 18.64 1,949,113 18.66
West 3,277,717 25.60 2,698,613 25.83
Other 58,501 .46 9,784 .09
12,803,969 100.00% 10,445,480 100.00%
Less securitized
balances (8,460,067) (7,523,801)
Total loans $ 4,343,902 $ 2,921,679
Capital One 53
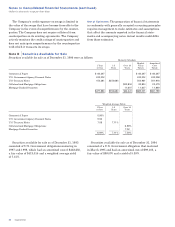
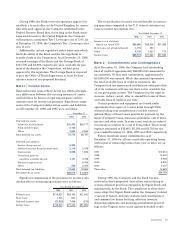
Note N Disclosures About Fair Value of
Financial Instruments
The following discloses the fair value of financial instru-
ments as of December 31, 1996 and 1995, whether or not
recognized in the balance sheets, for which it is practical to
estimate fair value. In cases where quoted market prices
are not available, fair values are based on estimates using
present value or other valuation techniques. Those tech-
niques are significantly affected by the assumptions used,
including the discount rate and estimates of future cash
flows. In that regard, the derived fair value estimates can-
not be substantiated by comparison to independent mar-
kets and, in many cases, could not be realized in immediate
settlement of the instrument. As required under generally
accepted accounting principles, these disclosures exclude
certain financial instruments and all nonfinancial instru-
ments from its disclosure requirements. Accordingly, the
aggregate fair value amounts presented do not represent
the underlying value of the Company.
The following methods and assumptions were used by
the Company in estimating the fair value as of
December 31, 1996 and 1995, for its financial instruments:
Cash and Due from Banks: The carrying amount
approximated fair value.
Cash Equivalents: The carrying amounts of federal
funds sold and interest-bearing deposits at other banks
approximated fair value.
Securities Available for Sale: The fair value of securities
available for sale was determined using current market
prices. See Note B.
Consumer Loans: The net carrying amount approximated
fair value due to the relatively short average life and
variable interest rates on a substantial number of these
loans. This amount excluded any value related to account
relationships.
Interest Receivable: The carrying amount approximated
fair value.
Borrow ings: The carrying amounts of interest-bearing
deposits, short-term borrowings and deposit notes approxi-
mated fair value. The fair value of senior notes was
$3,722,000 and $2,553,000 as of December 31, 1996 and 1995,
respectively, determined based on quoted market prices.
Interest Payable: The carrying amount approximated
fair value.
Interest Rate Sw ap Agreements: The fair value was the
estimated amount that the Company would have received
to terminate the swap agreements at the respective dates,
taking into account the forward yield curve and the credit-
worthiness of the swap counterparties. As of December 31,
1996 and 1995, the estimated fair value was $32,700 and
$85,200, respectively.