Capital One 1996 Annual Report Download - page 28
Download and view the complete annual report
Please find page 28 of the 1996 Capital One annual report below. You can navigate through the pages in the report by either clicking on the pages listed below, or by using the keyword search tool below to find specific information within the annual report.-
 1
1 -
2
-
3
-
4
-
5
-
6
-
7
-
8
-
9
-
10
-
11
-
12
-
13
-
14
-
15
-
16
-
17
-
 18
18 -
 19
19 -
 20
20 -
 21
21 -
 22
22 -
 23
23 -
 24
24 -
 25
25 -
 26
26 -
 27
27 -
 28
28 -
 29
29 -
 30
30 -
 31
31 -
 32
32 -
 33
33 -
 34
34 -
 35
35 -
 36
36 -
 37
37 -
 38
38 -
39
-
40
-
41
-
42
-
43
-
44
-
45
-
46
-
47
-
48
-
49
-
50
-
51
-
52
-
53
-
54
-
55
-
56
-
57
-
58
-
59
 |
 |

Capital One
Management’s Discussion and Analysis of
Financial Condition and Results of Operations (continued)
26
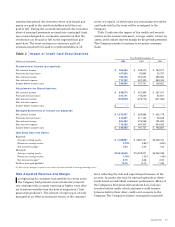
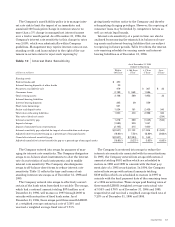
Non-Interest Expense
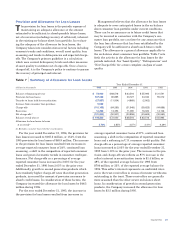
Non-interest expense for the year ended December 31,
1996 increased $215.8 million, or 43%, to $713.2 mil-
lion from $497.4 million for the year ended December 31,
1995. Contributing to the increase in non-interest expense
were solicitation expenses which increased $59.8 million,
or 41%, to $206.6 million in 1996 from $146.8 million in
1995. Solicitation expense represents the cost to select,
print and mail the Company’s product offerings to potential
and existing customers utilizing its information-based
strategy and account management techniques. This
increase also reflects the Company’s expectation that it will
continue to invest in second generation products, as well as
other new products and services (see “Business Outlook”
for further discussion). All other non-interest expenses
increased $155.9 million, or 44%, to $506.6 million for the
year ended December 31, 1996 from $350.6 million in 1995.
The increase in other non-interest expense, including
salaries and associate benefits, was primarily a result of an
increase in the average number of accounts of 30% for the
year ended December 31, 1996. Other factors impacting
1996 non-interest expense levels include a product mix
shift to more service-intensive, second generation accounts,
additional staff associated with building infrastructure, an
increase in charge volume and an increase in certain costs
associated with information systems enhancements.
Non-interest expense for the year ended December 31,
1995 increased $113.1 million, or 29%, to $497.4 million
from $384.3 million in the year ended December 31, 1994.
The increase would have been higher without the $49.0
million expense in 1994 for settlement costs to terminate a
long-term data processing services contract. Solicitation
expense increased $45.9 million, or 46%, to $146.8 million
in 1995 from $100.9 million in 1994.
For all periods prior to the Separation, non-interest
expense includes an allocation of expenses for data process-
ing, accounting, audit, human resources, corporate secre-
tary, treasury, legal and other administrative support
provided by Signet. Management believes the allocation
methods used were reasonable.
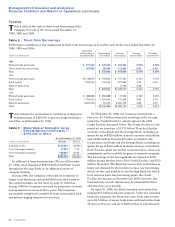
Income Taxes
The Company’s effective income tax rate increased to
37.5% for the year ended December 31, 1996 as com-
pared to 36% for 1995 and includes both state and federal
income tax components. The increase in the effective tax
rate is primarily the result of increased state tax expense
as the Company expands its operations into multiple juris-
dictions. For all periods prior to February 28, 1995, the
Company was included in Signet’s consolidated tax return
and income tax expense was determined on a separate
return basis at the federal statutory rate of 35%.
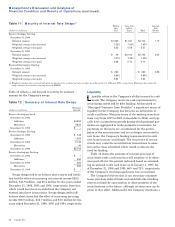
Asset Quality
The asset quality of a portfolio is generally a function of
the initial underwriting criteria used, seasoning of the
accounts, account management activities and geographic,
demographic, or other forms of concentration, as well as
general economic conditions.
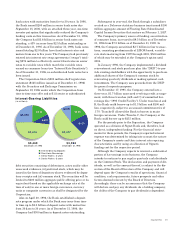
The average age of the accounts is also an important
indicator of the delinquency and loss levels of the portfolio.
Accounts tend to exhibit a rising trend of delinquency and
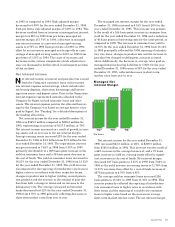
credit losses as they season. As of December 31, 1996, 53%
of managed accounts, representing 42% of the total man-
aged loan balance, were less than 18 months old.
Accordingly, it is likely that the Company’s managed loan
portfolio will experience increased levels of delinquency
and loan losses as the average age of the Company’s
accounts increases.
Another factor contributing to the expectation of a rising
rate of delinquency and credit losses is a shift in the prod-
uct mix. As discussed in “Risk Adjusted Revenue and
Margin”, certain second generation products have higher
delinquency and charge-off rates. In the case of secured
card loans, collateral, in the form of cash deposits, reduces
any ultimate charge-offs. The costs associated with higher
delinquency and charge-off rates are considered in the pric-
ing of individual products.
During 1996, general economic conditions for consumer
credit worsened as industry levels of charge-offs (including
bankruptcies) and delinquencies both increased significantly.
These trends have impacted the Company’s 1996 results.
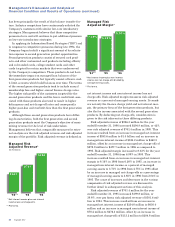
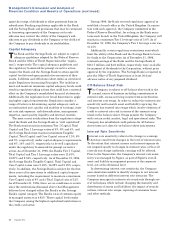
‘94
Marketing Investment
(in millions)
‘95 ‘96
$101
$147
$207