Capital One 1996 Annual Report Download - page 19
Download and view the complete annual report
Please find page 19 of the 1996 Capital One annual report below. You can navigate through the pages in the report by either clicking on the pages listed below, or by using the keyword search tool below to find specific information within the annual report.-
 1
1 -
2
-
3
-
4
-
5
-
6
-
7
-
8
-
 9
9 -
 10
10 -
 11
11 -
 12
12 -
 13
13 -
 14
14 -
 15
15 -
 16
16 -
 17
17 -
 18
18 -
 19
19 -
 20
20 -
 21
21 -
 22
22 -
 23
23 -
 24
24 -
 25
25 -
 26
26 -
 27
27 -
 28
28 -
 29
29 -
30
-
31
-
32
-
33
-
34
-
35
-
36
-
37
-
38
-
39
-
40
-
41
-
42
-
43
-
44
-
45
-
46
-
47
-
48
-
49
-
50
-
51
-
52
-
53
-
54
-
55
-
56
-
57
-
58
-
59
 |
 |
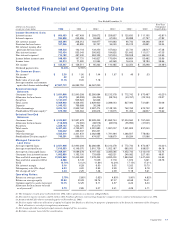
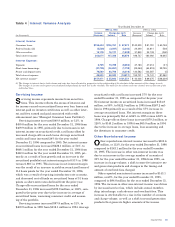
Year Ended December 31
Five-Year
(dollars in thousands, Compound
except per share data) 1996 1995 1994(1) 1993(1) 1992(1) 1991(1) Growth Rate
Income Statement Data:
Interest income $ 660,483 $ 457,409 $ 258,672 $ 259,857 $ 120,630 $ 111,195 42.81%
Interest expense 294,999 249,396 93,695 67,994 29,888 41,797 47.82
Net interest income 365,484 208,013 164,977 191,863 90,742 69,398 39.41
Provision for loan losses 167,246 65,895 30,727 34,030 55,012 40,891 32.54
Net interest income after
provision for loan losses 198,238 142,118 134,250 157,833 35,730 28,507 47.38
Non-interest income 763,424 553,043 396,902 194,825 121,642 111,017 47.05
Non-interest expense(2) 713,182 497,430 384,325 181,804 108,508 86,042 52.65
Income before income taxes 248,480 197,731 146,827 170,854 48,864 53,482 35.96
Income taxes 93,213 71,220 51,564 60,369 16,614 18,184 38.66
Net income $ 155,267 $ 126,511 $ 95,263 $ 110,485 $ 32,250 $ 35,298 34.48%
Dividend payout ratio 13.24% 12.55%
Per Common Share:
Net income(3) $ 2.30 $ 1.90 $ 1.44 $ 1.67 $ .49 $ .53
Dividends .32 .24
Book value at year-end 11.16 9.05 7.18
Average common and common
equivalent shares outstanding(3) 67,587,712 66,592,750 66,067,250
Selected Average
Balances:
Consumer loans $ 3,651,908 $ 2,940,208 $2,286,684 $2,213,378 $ 772,742 $ 673,487 40.23%
Allowance for loan losses (83,573) (69,939) (66,434) (59,754) (43,767) (23,154) 29.27
Securities 1,147,079 949,923 62,626
Total assets 5,568,960 4,436,055 2,629,920 2,289,043 827,093 731,881 50.06
Deposits 1,046,122 769,688 36,248
Other borrowings 3,623,104 2,952,162 2,287,474 2,148,155 762,762 675,732 39.91
Stockholders’/Division equity(4) 676,759 543,364 239,616 113,815 51,454 46,807 70.62
Selected Year-End
Balances:
Consumer loans $ 4,343,902 $ 2,921,679 $2,228,455 $1,862,744 $1,304,560 $ 767,448
Allowance for loan losses (118,500) (72,000) (68,516) (63,516) (55,993) (31,541)
Securities 1,358,103 1,233,796 412,070
Total assets 6,467,445 4,759,321 3,091,980 1,991,207 1,351,802 837,240
Deposits 943,022 696,037 452,201
Other borrowings 4,525,216 3,301,672 2,062,688 1,791,464 1,266,507 778,082
Stockholders’/Division equity(4) 740,391 599,191 474,557 168,879 69,294 51,586
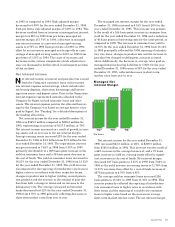
Managed Consumer
Loan Data:
Average reported loans $ 3,651,908 $ 2,940,208 $2,286,684 $2,213,378 $ 772,742 $ 673,487 40.23%
Average securitized loans 7,616,553 6,149,070 3,910,739 1,052,187 680,000 638,531 64.18
Average total managed loans 11,268,461 9,089,278 6,197,423 3,265,565 1,452,742 1,312,018 53.74
Consumer loan interest income 1,662,990 1,192,100 733,659 432,521 249,082 227,165 48.91
Year-end total managed loans 12,803,969 10,445,480 7,378,455 4,832,400 1,984,560 1,447,448 54.65
Year-end total accounts (000’s) 8,586 6,149 5,049 3,118 1,672 1,261 46.76
Yield 14.76% 13.12% 11.84% 13.24% 17.15% 17.31%
Net interest margin 8.16 6.28 6.90 9.55 12.63 10.70
Delinquency rate (30+ days) 6.24 4.20 2.95 2.39 5.30 8.18
Net charge-off rate(5) 4.24 2.25 1.48 2.09 5.18 5.61
Operating Ratios:
Return on average assets 2.79% 2.85% 3.62% 4.83% 3.90% 4.82%
Return on average equity 22.94 23.28 39.76 97.07 62.68 75.41
Common equity to assets (average) 12.15 12.25 9.11 4.97 6.22 6.40
Allowance for loan losses to loans
as of year-end(6) 2.73 2.85 3.07 3.41 4.29 4.11
(1) The Company’s results prior to November 22, 1994, reflect operations as a division of Signet Bank.
(2) Non-interest expense includes a $49.0 million ($31.9 million after-tax) nonrecurring charge for computer services contract termination expense in 1994.
(3) Assumes 66,067,250 shares outstanding prior to November 22, 1994.
(4) Division equity reflects an allocation of capital to Capital One Bank as a division for purposes of preparation of the financial statements of the Company.
Such allocation is not subject to regulatory minimums.
(5) Net charge-offs reflect actual principal amounts charged off less recoveries.
(6) Excludes consumer loans held for securitization.
Selected Financial and Operating Data
Capital One 17