Capital One 1996 Annual Report Download - page 24
Download and view the complete annual report
Please find page 24 of the 1996 Capital One annual report below. You can navigate through the pages in the report by either clicking on the pages listed below, or by using the keyword search tool below to find specific information within the annual report.-
 1
1 -
2
-
3
-
4
-
5
-
6
-
7
-
8
-
9
-
10
-
11
-
12
-
13
-
 14
14 -
 15
15 -
 16
16 -
 17
17 -
 18
18 -
 19
19 -
 20
20 -
 21
21 -
 22
22 -
 23
23 -
 24
24 -
 25
25 -
 26
26 -
 27
27 -
 28
28 -
 29
29 -
 30
30 -
 31
31 -
 32
32 -
 33
33 -
 34
34 -
35
-
36
-
37
-
38
-
39
-
40
-
41
-
42
-
43
-
44
-
45
-
46
-
47
-
48
-
49
-
50
-
51
-
52
-
53
-
54
-
55
-
56
-
57
-
58
-
59
 |
 |

Capital One
Management’s Discussion and Analysis of
Financial Condition and Results of Operations (continued)
22
has been principally the result of this balance transfer fea-
ture. Industry competitors have continuously solicited the
Company’s customers with similar low-rate introductory
strategies. Management believes that these competitive
pressures have and will continue to put additional pressure
on low-rate introductory strategies.
In applying its Information-Based Strategies (“IBS”) and
in response to competitive pressures during late 1994, the
Company began to shift a significant amount of its solicita-
tion expense to second generation product opportunities.
Second generation products consist of secured card prod-
ucts and other customized card products including affinity
and co-branded cards, college student cards and other
cards targeted to certain markets that were underserved
by the Company’s competitors. These products do not have
the immediate impact on managed loan balances of the
first generation products but typically consist of lower cred-
it limit accounts which build balances over time. The terms
of the second generation products tend to include annual
membership fees and higher annual finance charge rates.
The higher risk profile of the customers targeted for the
second generation products and the lower credit limit asso-
ciated with these products also tend to result in higher
delinquency and net charge-off rates and consequently
higher past-due and overlimit fees than the first generation
products.
Although these second generation products have differ-
ing characteristics, both the first generation and second
generation products meet the Company’s objective of maxi-
mizing revenue for the level of risk undertaken.
Management believes that comparable measures for exter-
nal analysis are the risk adjusted revenue and risk adjusted
margin of the portfolio. Risk adjusted revenue is defined as
net interest income and non-interest income less net
charge-offs. Risk adjusted margin measures risk adjusted
revenue as a percent of managed earning assets. It consid-
ers not only the finance charge yield and net interest mar-
gin, the primary focus of the first generation products, but
also the fee income associated with the second generation
products. By deducting net charge-offs, consideration is
given to the risk inherent in these differing products.
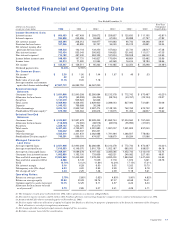
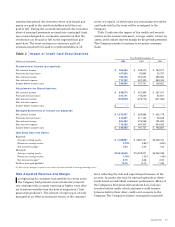
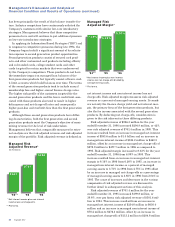
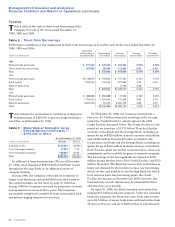
Risk adjusted revenue of $996.3 million for the year
ended December 31, 1996 increased $294.9 million, or 42%,
over risk adjusted revenue of $701.4 million in 1995. This
increase resulted from an increase in managed net interest
income of $383.6 million to $1.0 billion and an increase in
managed non-interest income of $184.2 million to $460.5
million, offset by an increase in managed net charge-offs of
$272.9 million to $477.7 million in 1996 as compared to
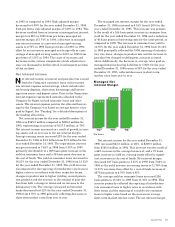
1995. Risk adjusted margin increased to 8.02% for the year
ended December 31, 1996 from 6.99% in 1995. This
increase resulted from an increase in managed net interest
margin to 8.16% in 1996 from 6.28% in 1995, an increase in
managed non-interest income as a percent of managed
earning assets to 3.71% in 1996 from 2.75% in 1995 offset
by an increase in managed net charge-offs as a percentage
of managed earning assets to 3.85% in 1996 from 2.04% in
1995. The cause of increases and decreases in the various
components of risk adjusted revenue are discussed in
further detail in subsequent sections of this analysis.
Risk adjusted revenue of $701.4 million for the year
ended December 31, 1995 increased $199.8 million, or
39.8%, over pro forma risk adjusted revenue of $501.6 mil-
lion in 1994. This increase resulted from an increase in
managed net interest income of $234.8 million to $630.0
million and an increase in managed non-interest income of
$78.2 million to $276.3 million, offset by an increase in
managed net charge-offs of $113.2 million to $204.8 million
‘94* *
Managed Risk
Adjusted Revenue*
(in millions)
‘95 ‘96
*Net interest income plus non-interest
income less net charge-offs.
$502
$701
$996
** Pro forma.
** Pro forma.
‘94* *
Managed Risk
Adjusted Margin*
‘95 ‘96
*Net interest income plus non-interest
income less net charge-offs divided by
average earning assets.
7.29% 6.99%
8.02%