Capital One 1996 Annual Report Download - page 23
Download and view the complete annual report
Please find page 23 of the 1996 Capital One annual report below. You can navigate through the pages in the report by either clicking on the pages listed below, or by using the keyword search tool below to find specific information within the annual report.-
 1
1 -
2
-
3
-
4
-
5
-
6
-
7
-
8
-
9
-
10
-
11
-
12
-
 13
13 -
 14
14 -
 15
15 -
 16
16 -
 17
17 -
 18
18 -
 19
19 -
 20
20 -
 21
21 -
 22
22 -
 23
23 -
 24
24 -
 25
25 -
 26
26 -
 27
27 -
 28
28 -
 29
29 -
 30
30 -
 31
31 -
 32
32 -
 33
33 -
34
-
35
-
36
-
37
-
38
-
39
-
40
-
41
-
42
-
43
-
44
-
45
-
46
-
47
-
48
-
49
-
50
-
51
-
52
-
53
-
54
-
55
-
56
-
57
-
58
-
59
 |
 |

Capital One 21
amortization period, the investors’ share of principal pay-
ments are paid to the certificateholders until they are
paid in full. During the accumulation period, the investors’
share of principal payments are paid into a principal fund-
ing account designed to accumulate amounts so that the
certificates can be paid in full on the expected final pay-
ment date. The trust continues in existence until all
amounts required to be paid to certificateholders of all
series are repaid, at which time any remaining receivables
and funds held in the trust will be reassigned to the
Company.
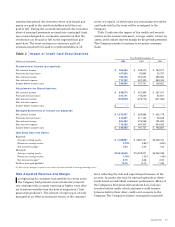
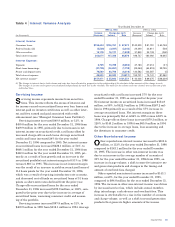
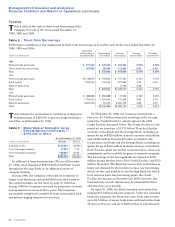
Table 2 indicates the impact of the credit card securiti-
zations on the income statement, average assets, return on
assets, yield and net interest margin for the periods presented.
The Company intends to continue to securitize consumer
loans.
Table 2 Impact of Credit Card Securitizations
Year Ended December 31
(dollars in thousands) 1996 1995 1994
Statements of Income (as reported):
Net interest income $ 365,484 $ 208,013 $ 164,977
Provision for loan losses 167,246 65,895 30,727
Non-interest income 763,424 553,043 396,902
Non-interest expense 713,182 497,430 384,325
Income before income taxes $ 248,480 $ 197,731 $ 146,827
Adjustments for Securitizations:
Net interest income $ 648,073 $ 421,983 $ 267,201
Provision for loan losses 345,141 145,209 65,921
Non-interest income (302,932) (276,774) (201,280)
Non-interest expense
Income before income taxes $ – $ – $ –
Managed Statements of Income (as adjusted):
Net interest income $ 1,013,557 $ 629,996 $ 432,178
Provision for loan losses 512,387 211,104 96,648
Non-interest income 460,492 276,269 195,622
Non-interest expense 713,182 497,430 384,325
Income before income taxes $ 248,480 $ 197,731 $ 146,827
Operating Data and Ratios:
Reported:
Average earning assets $ 4,798,987 $ 3,890,131 $2,349,310
Return on average assets 2.79% 2.85% 3.62%
Net interest margin(1) 7.62 5.35 7.02
Managed:
Average earning assets $12,415,540 $10,039,201 $6,260,049
Return on average assets 1.18% 1.20% 1.46%
Net interest margin(1) 8.16 6.28 6.90
Yield on managed portfolio 14.76 13.12 11.84
(1) Net interest margin is equal to net interest income divided by average earning assets.
Risk Adjusted Revenue and M argin
In originating its consumer loan portfolio in recent years,
the Company had pursued a low introductory interest
rate strategy with accounts repricing to higher rates after
six to sixteen months from the date of origination (“first
generation products”). The amount of repricing is actively
managed in an effort to maximize return at the customer
level, reflecting the risk and expected performance of the
account. Accounts also may be repriced upwards or down-
wards based on individual customer performance. Many of
the Company’s first generation products had a balance
transfer feature under which customers could transfer
balances held in their other credit card accounts to the
Company. The Company’s historic managed loan growth