Capital One 1996 Annual Report Download - page 27
Download and view the complete annual report
Please find page 27 of the 1996 Capital One annual report below. You can navigate through the pages in the report by either clicking on the pages listed below, or by using the keyword search tool below to find specific information within the annual report.-
 1
1 -
2
-
3
-
4
-
5
-
6
-
7
-
8
-
9
-
10
-
11
-
12
-
13
-
14
-
15
-
16
-
 17
17 -
 18
18 -
 19
19 -
 20
20 -
 21
21 -
 22
22 -
 23
23 -
 24
24 -
 25
25 -
 26
26 -
 27
27 -
 28
28 -
 29
29 -
 30
30 -
 31
31 -
 32
32 -
 33
33 -
 34
34 -
 35
35 -
 36
36 -
 37
37 -
38
-
39
-
40
-
41
-
42
-
43
-
44
-
45
-
46
-
47
-
48
-
49
-
50
-
51
-
52
-
53
-
54
-
55
-
56
-
57
-
58
-
59
 |
 |

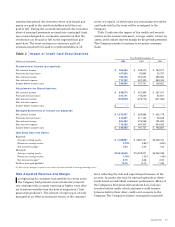
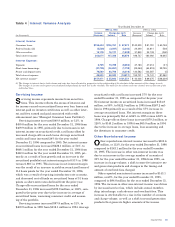
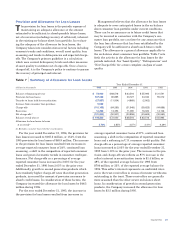
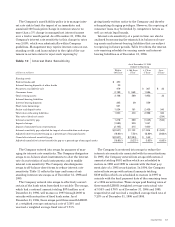
Table 4 Interest Variance Analysis Year Ended December 31
1996 vs. 1995 1995 vs. 1994
Increase Change due to (1) Increase Change due to (1)
(in thousands) (Decrease) Volume Rate (Decrease) Volume Rate
Interest Income:
Consumer loans $194,434 $106,761 $ 87,673 $142,539 $ 81,791 $ 60,748
Federal funds sold (5,539) (3,297) (2,242) 24,349 23,811 538
Other securities 14,179 16,127 (1,948) 31,849 32,109 (260)
Total interest income 203,074 117,398 85,676 198,737 180,092 18,645
Interest Expense:
Deposits 6,725 15,788 (9,063) 47,183 47,214 (31)
Short-term borrowings (37,705) (35,967) (1,738) (25,064) (64,819) 39,755
Senior and deposit notes 76,583 82,799 (6,216) 133,582 133,587 (5)
Total interest expense 45,603 60,520 (14,917) 155,701 74,141 81,560
Net interest income(1) $157,471 $ 55,920 $101,551 $ 43,036 $ 89,275 $(46,239)
(1) The change in interest due to both volume and rates has been allocated in proportion to the relationship of the absolute dollar amounts of the change in each.
The changes in income and expense are calculated independently for each line in the schedule. The totals for the volume and rate columns are not the sum of the
individual lines.
Capital One 25
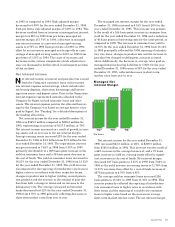
Servicing Income
Servicing income represents income from securitiza-
tions. This income reflects the excess of interest and
fee income earned on securitized loans over loan losses and
interest paid on investor certificates as well as other inter-
est and fees earned and paid associated with credit
enhancement (see “Managed Consumer Loan Portfolio”).
Servicing income increased $49.9 million, or 12%, to
$459.8 million for the year ended December 31, 1996 from
$409.9 million in 1995, primarily due to increases in net
interest income on securitized credit card loans offset by
increased charge-offs on such loans. Average securitized
credit card loans increased 24% for the year ended
December 31, 1996 compared to 1995. Net interest income
on securitized loans increased $226.1 million, or 54%, to
$648.1 million for the year ended December 31, 1996 from
$422.0 million for the year ended December 31, 1995, pri-
marily as a result of loan growth and an increase in the
securitized portfolio’s net interest margin to 8.51% in 1996
versus 6.86% in 1995. This increase in net interest margin
was the result of an increase in yield on securitized loans of
114 basis points for the year ended December 31, 1996,
which was a result of repricing introductory rate accounts,
and decreased cost of funds on securitized loans of 51 basis
points as short-term rates declined from the prior year.
Charge-offs on securitized loans for the year ended
December 31, 1996 increased $199.9 million, or 138%, com-
pared to the prior year due to the increase in average of
securitized loans, worsening consumer credit and season-
ing of the portfolio.
Servicing income increased $97.8 million, or 31%, to
$409.9 million in 1995 from $312.1 million in 1994. Average
securitized credit card loans increased 57% for the year
ended December 31, 1995 as compared to the prior year.
Net interest income on securitized loans increased $154.8
million, or 58%, to $422.0 million in 1995 from $267.2 mil-
lion in 1994 primarily as a result of the 57% increase in
average securitized loans. Net interest margin on these
loans was principally flat at 6.86% in 1995 versus 6.83% in
1994. Charge-offs on these loans increased $79.3 million, or
120%, to $145.2 million in 1995 from $65.9 million in 1994
due to the increase in average loans, loan seasoning and
the downturn in consumer credit.
Other Non-Interest Income
Other reported non-interest income increased to $303.6
million, or 112%, for the year ended December 31, 1996
compared to $143.1 million for the year ended December
31, 1995. The increase in other non-interest income was
due to an increase in the average number of accounts of
30% for the year ended December 31, 1996 from 1995, an
increase in charge volume, a shift to more fee intensive sec-
ond generation products and changes in the timing and
amount of overlimit fees charged.
Other reported non-interest income increased to $143.1
million, or 69%, for the year ended December 31, 1995,
compared to $84.8 million for the year ended December 31,
1994. The increase in other non-interest income was driven
by increased service fees, which include annual member-
ship, interchange, cash advance and overlimit fees. This
increase is attributable to a rise in the number of accounts
and charge volume, as well as a shift to second generation
products that generate higher amounts of fee income.