Capital One 1996 Annual Report Download - page 29
Download and view the complete annual report
Please find page 29 of the 1996 Capital One annual report below. You can navigate through the pages in the report by either clicking on the pages listed below, or by using the keyword search tool below to find specific information within the annual report.-
 1
1 -
2
-
3
-
4
-
5
-
6
-
7
-
8
-
9
-
10
-
11
-
12
-
13
-
14
-
15
-
16
-
17
-
18
-
 19
19 -
 20
20 -
 21
21 -
 22
22 -
 23
23 -
 24
24 -
 25
25 -
 26
26 -
 27
27 -
 28
28 -
 29
29 -
 30
30 -
 31
31 -
 32
32 -
 33
33 -
 34
34 -
 35
35 -
 36
36 -
 37
37 -
 38
38 -
 39
39 -
40
-
41
-
42
-
43
-
44
-
45
-
46
-
47
-
48
-
49
-
50
-
51
-
52
-
53
-
54
-
55
-
56
-
57
-
58
-
59
 |
 |

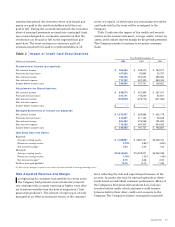
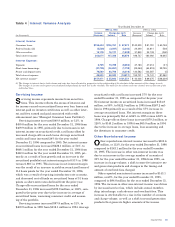
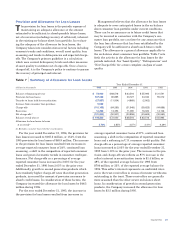
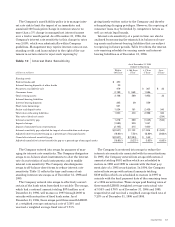
Table 5 Delinquencies(1)
December 31
1996 1995 1994 1993 1992
% of % of % of % of % of
Total Total Total Total Total
(dollars in thousands) Loans Loans Loans Loans Loans Loans Loans Loans Loans Loans
Reported:
Loans outstanding $ 4,343,902 100.00% $ 2,921,679 100.00% $2,228,455 100.00% $1,862,744 100.00% $1,304,560 100.00%
Loans delinquent:
30-59 days 96,819 2.23 65,711 2.25 29,032 1.30 19,186 1.03 21,525 1.65
60-89 days 55,679 1.28 38,311 1.31 14,741 .66 10,618 .57 11,089 .85
90 or more days 111,791 2.57 79,694 2.73 24,445 1.10 18,255 .98 23,352 1.79
Total $ 264,289 6.08% $ 183,716 6.29% $ 68,218 3.06% $ 48,059 2.58% $ 55,966 4.29%
Managed:
Loans outstanding $12,803,969 100.00% $10,445,480 100.00% $7,378,455 100.00% $4,832,400 100.00% $1,984,560 100.00%
Loans delinquent:
30-59 days 279,787 2.19 165,306 1.58 90,733 1.23 46,391 .96 40,088 2.02
60-89 days 162,668 1.27 92,665 .89 45,277 .61 25,128 .52 21,433 1.08
90 or more days 356,700 2.78 181,243 1.73 81,720 1.11 43,975 .91 43,661 2.20
Total $ 799,155 6.24% $ 439,214 4.20% $ 217,730 2.95% $ 115,494 2.39% $ 105,182 5.30%
(1) Includes consumer loans held for securitization.
Capital One 27
Delinquencies
Table 5 shows the Company’s consumer loan delinquency
trends for the periods presented as reported for finan-
cial statement purposes and on a managed basis. The
entire balance of an account is contractually delinquent if
the minimum payment is not received by the billing date.
However, the Company generally continues to accrue inter-
est until the loan is charged off. Delinquencies not only
have the potential to impact earnings in the form of net
charge-offs, they also are costly in terms of the personnel
and other resources dedicated to resolving them.
The 30-plus day delinquency rate for the reported con-
sumer loan portfolio decreased to 6.08% as of December 31,
1996, from 6.29% as of December 31, 1995. The modest
decrease in 1996 reported delinquency reflects the securiti-
zation of certain second generation receivables in 1996.
The delinquency rate for the total managed consumer
loan portfolio was 6.24% of related loans as of December
31, 1996, up from 4.20% as of December 31, 1995, while the
dollar amount of delinquent managed consumer loans
increased approximately $359.9 million. The managed
portfolio’s delinquency rate as of December 31, 1996 princi-
pally reflected the continued seasoning of accounts and
consumer loan balances, the increased presence of second
generation products and general economic trends in
consumer credit performance.
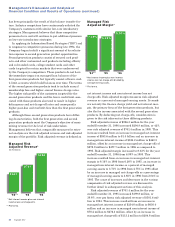
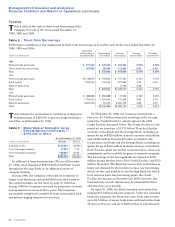
‘94
Managed Net Charge-Off
and 30+ Day
Delinquency Rate
‘95 ‘96
■ Net Charge-off Rate
■ Delinquency Rate
1.48%
2.25%
4.24%
2.95%
4.20%
6.24%