Capital One 1996 Annual Report Download - page 26
Download and view the complete annual report
Please find page 26 of the 1996 Capital One annual report below. You can navigate through the pages in the report by either clicking on the pages listed below, or by using the keyword search tool below to find specific information within the annual report.-
 1
1 -
2
-
3
-
4
-
5
-
6
-
7
-
8
-
9
-
10
-
11
-
12
-
13
-
14
-
15
-
 16
16 -
 17
17 -
 18
18 -
 19
19 -
 20
20 -
 21
21 -
 22
22 -
 23
23 -
 24
24 -
 25
25 -
 26
26 -
 27
27 -
 28
28 -
 29
29 -
 30
30 -
 31
31 -
 32
32 -
 33
33 -
 34
34 -
 35
35 -
 36
36 -
37
-
38
-
39
-
40
-
41
-
42
-
43
-
44
-
45
-
46
-
47
-
48
-
49
-
50
-
51
-
52
-
53
-
54
-
55
-
56
-
57
-
58
-
59
 |
 |

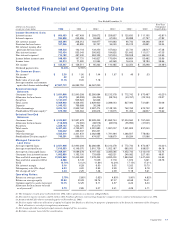
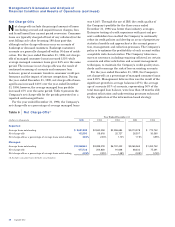
Table 3 Statement of Average Balances, Income and Expense, Yields and Rates
Year Ended December 31
1996 1995 1994
Average Income/ Yield/ Average Income/ Yield/ Average Income/ Yield/
(dollars in thousands) Balance Expense Rate Balance Expense Rate Balance Expense Rate
Assets:
Earning assets
Consumer loans(1) $3,651,908 $592,088 16.21% $2,940,208 $397,654 13.52% $2,286,684 $255,115 11.16%
Federal funds sold 394,939 21,293 5.39 453,797 26,832 5.91 49,709 2,483 5.00
Other securities 752,140 47,102 6.26 496,126 32,923 6.64 12,917 1,074 8.31
Total earning assets 4,798,987 $660,483 13.76% 3,890,131 $457,409 11.76% 2,349,310 $258,672 11.01%
Cash and due from banks 40,698 9,309 8,331
Allowance for loan losses (83,573) (69,939) (66,434)
Premises and equipment, net 156,441 123,472 53,039
Other assets 656,407 483,082 285,674
Total assets $5,568,960 $4,436,055 $2,629,920
Liabilities and Equity:
Interest-bearing liabilities
Deposits $1,046,122 $ 56,272 5.38% $ 769,688 $ 49,547 6.44% $ 36,248 $ 2,364 6.52%
Short-term borrowings 454,899 28,509 6.27 1,028,075 66,214 6.44 2,286,779 91,278 3.99
Senior and deposit notes 3,168,205 210,218 6.64 1,924,087 133,635 6.95 695 53 7.63
Total interest-bearing liabilities 4,669,226 $294,999 6.32% 3,721,850 $249,396 6.70% 2,323,722 $ 93,695 4.03%
Other liabilities 222,975 170,841 66,582
Total liabilities 4,892,201 3,892,691 2,390,304
Equity 676,759 543,364 239,616
Total liabilities and equity $5,568,960 $4,436,055 $2,629,920
Net interest spread 7.44% 5.06% 6.98%
Interest income to average
earning assets 13.76% 11.76% 11.01%
Interest expense to average
earning assets 6.14 6.41 3.99
Net interest margin 7.62% 5.35% 7.02%
(1) Interest income includes past-due fees on loans of approximately $94,393, $50,384 and $16,478 for the years ended December 31, 1996, 1995 and 1994,
respectively.
Capital One
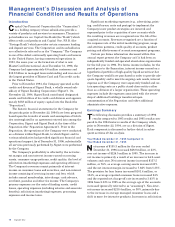
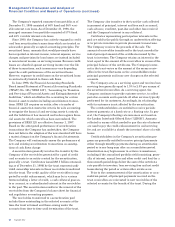
Management’s Discussion and Analysis of
Financial Condition and Results of Operations (continued)
24
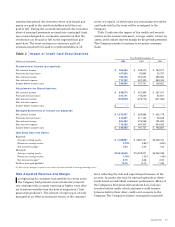
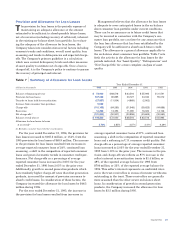
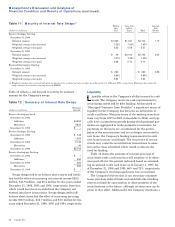
Table 4 sets forth the dollar amount of the increase
(decrease) in interest income and interest expense result-
ing from changes in the volume of earning assets and inter-
est-bearing liabilities and from changes in yields and rates.
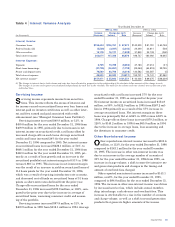
Interest Variance Analysis
Net interest income is affected by changes in the aver-
age interest rate earned on earning assets and the
average interest rate paid on interest-bearing liabilities. In
addition, net interest income is affected by changes in the
volume of earning assets and interest-bearing liabilities.
was also impacted by an increased percentage of lower
yielding securities (24% of average earning assets in 1995
versus 3% in 1994). The increase in the cost of funds
reflected the increase in average short-term market inter-
est rates and incrementally higher market cost of funds
paid by the Company on a stand-alone basis after the
Separation versus the amounts allocated by Signet in 1994.
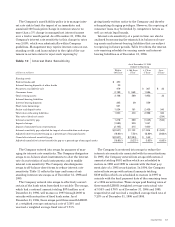
Table 3 provides average balance sheet data, an analysis
of net interest income, net interest spread (the difference
between the yield on earning assets and the cost of inter-
est-bearing liabilities) and net interest margin for each of
the years ended December 31, 1996, 1995 and 1994,
respectively.