Capital One 1996 Annual Report Download - page 39
Download and view the complete annual report
Please find page 39 of the 1996 Capital One annual report below. You can navigate through the pages in the report by either clicking on the pages listed below, or by using the keyword search tool below to find specific information within the annual report.-
 1
1 -
2
-
3
-
4
-
5
-
6
-
7
-
8
-
9
-
10
-
11
-
12
-
13
-
14
-
15
-
16
-
17
-
18
-
19
-
20
-
21
-
22
-
23
-
24
-
25
-
26
-
27
-
28
-
 29
29 -
 30
30 -
 31
31 -
 32
32 -
 33
33 -
 34
34 -
 35
35 -
 36
36 -
 37
37 -
 38
38 -
 39
39 -
 40
40 -
 41
41 -
 42
42 -
 43
43 -
 44
44 -
 45
45 -
 46
46 -
 47
47 -
 48
48 -
 49
49 -
50
-
51
-
52
-
53
-
54
-
55
-
56
-
57
-
58
-
59
 |
 |
1996 1995
Fourth Third Second First Fourth Third Second First
(unaudited) Quarter Quarter Quarter Quarter Quarter Quarter Quarter Quarter
Summary of Operations
(in thousands)
Interest income $201,353 $188,235 $137,753 $133,142 $134,997 $128,913 $104,432 $ 89,067
Interest expense 87,784 81,581 63,300 62,334 69,941 69,252 59,210 50,993
Net interest income 113,569 106,654 74,453 70,808 65,056 59,661 45,222 38,074
Provision for loan losses 63,035 53,933 25,110 25,168 21,347 18,652 17,260 8,636
Net interest income after
provision for loan losses 50,534 52,721 49,343 45,640 43,709 41,009 27,962 29,438
Non-interest income 214,961 206,716 170,599 171,148 151,234 136,860 134,789 130,160
Non-interest expense 200,575 196,823 159,334 156,450 135,834 124,808 116,432 120,356
Income before income taxes 64,920 62,614 60,608 60,338 59,109 53,061 46,319 39,242
Income taxes 24,670 23,793 22,425 22,325 21,301 19,113 16,673 14,133
Net income $ 40,250 $ 38,821 $ 38,183 $ 38,013 $ 37,808 $ 33,948 $ 29,646 $ 25,109
Per Common Share
Net income $ .60 $ .58 $ .57 $ .57 $ .57 $ .51 $ .45 $ .38
Dividends .08 .08 .08 .08 .08 .08 .08
Market prices
High 365/8317/8321/8277/8291/4295/8221/220
Low 297/8257/825 217/8223/4191/2181/4153/8
Average common and common equivalent
shares (000’s) 67,643 67,058 66,893 66,806 66,710 66,727 66,466 66,251
Average Balance Sheet Data
(in millions)
Consumer loans $ 4,648 $ 3,955 $ 3,249 $ 2,742 $ 3,166 $ 3,333 $ 2,883 $ 2,365
Allowance for loan losses (105) (81) (74) (74) (74) (70) (68) (67)
Securities 1,164 1,228 933 1,302 1,248 926 853 805
Other assets 929 990 793 721 704 775 494 473
Total assets $ 6,636 $ 6,092 $ 4,901 $ 4,691 $ 5,044 $ 4,964 $ 4,162 $ 3,576
Interest-bearing deposits $ 1,298 $ 1,234 $ 789 $ 859 $ 843 $ 899 $ 741 $ 591
Short-term borrowings 472 466 349 527 935 956 843 1,384
Senior and deposit notes 3,843 3,435 2,875 2,510 2,492 2,322 1,854 1,008
Other liabilities 290 259 244 164 183 232 196 95
Stockholders’ equity 733 698 644 631 591 555 528 498
Total liabilities and equity $ 6,636 $ 6,092 $ 4,901 $ 4,691 $ 5,044 $ 4,964 $ 4,162 $ 3,576
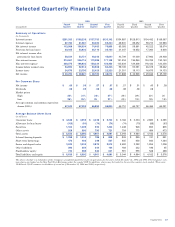
The above schedule is a tabulation of the Company’s unaudited quarterly results of operations for the years ended December 31, 1996 and 1995. The Company’s com-
mon shares are traded on the New York Stock Exchange under the symbol COF. In addition, shares may be traded in the over-the-counter stock market. There were
14,562 and 13,247 common stockholders of record as of December 31, 1996 and 1995, respectively.
Selected Quarterly Financial Data
Capital One 37