Capital One 1996 Annual Report Download - page 21
Download and view the complete annual report
Please find page 21 of the 1996 Capital One annual report below. You can navigate through the pages in the report by either clicking on the pages listed below, or by using the keyword search tool below to find specific information within the annual report.-
 1
1 -
2
-
3
-
4
-
5
-
6
-
7
-
8
-
9
-
10
-
 11
11 -
 12
12 -
 13
13 -
 14
14 -
 15
15 -
 16
16 -
 17
17 -
 18
18 -
 19
19 -
 20
20 -
 21
21 -
 22
22 -
 23
23 -
 24
24 -
 25
25 -
 26
26 -
 27
27 -
 28
28 -
 29
29 -
 30
30 -
 31
31 -
32
-
33
-
34
-
35
-
36
-
37
-
38
-
39
-
40
-
41
-
42
-
43
-
44
-
45
-
46
-
47
-
48
-
49
-
50
-
51
-
52
-
53
-
54
-
55
-
56
-
57
-
58
-
59
 |
 |

Capital One 19
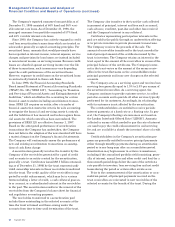
costs of $59.8 million, or 41%, and other non-interest
expenses of $155.9 million, or 44%, reflect the increase in
marketing investment in existing and new product oppor-
tunities and the cost of operations to build infrastructure
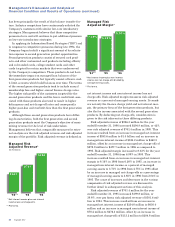
and manage the growth in accounts. Average managed con-
sumer loans grew 24% for the year ended December 31,
1996, to $11.3 billion from $9.1 billion for the year ended
December 31, 1995, and average managed accounts grew
30% for the same period to 7.5 million from 5.7 million as a
result of the continued success of the Company’s solicita-
tion and account management strategies.
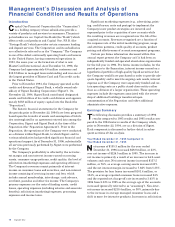
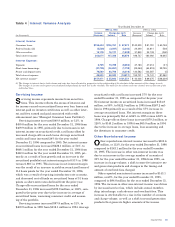
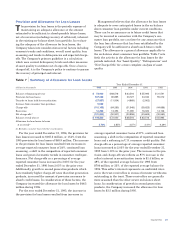
Year Ended December 31, 1995 Compared to
Year Ended December 31, 1994
Net income for the year ended December 31, 1995 of
$126.5 million increased $31.2 million, or 33%, over
net income of $95.3 million in 1994. The increase in net
income was partially attributable to the $31.9 million
(after-tax) nonrecurring charge for 1994 settlement costs to
terminate a long-term data processing services contract.
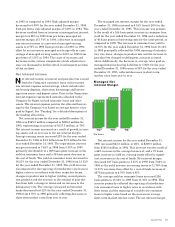
Other factors affecting net income include the increase
in net interest income of $43.0 million, or 26%, the result of
a 66% increase in average earning assets, offset by a
decrease in the net interest margin to 5.35% from 7.02%.
The decrease in net interest margin reflected overall increas-
es in average short-term market interest rates plus the
absence of a stand-alone hedging program prior to the
Separation. The provision for loan losses increased $35.2
million, or 114%, as average reported consumer loans
increased 37% and the reported net charge-off rate
increased to 2.03% in 1995 from 1.13%
in 1994 as the accounts seasoned. Non-interest income
increased $156.1 million, or 39%, primarily due to the
increase in average managed loans, including those securi-
tized. Increases in solicitation costs of $45.9 million, or
46%, and other non-interest expenses (excluding the con-
tract termination expense of $49.0 million) of $116.2 mil-
lion, or 50%, reflect the increase in marketing investment
in existing and new product opportunities and the cost of
operations to manage the growth in accounts. Average
managed loans grew to $9.1 billion, or 47%, from $6.2 bil-
lion as a result of the success of the Company’s solicitation
and account management strategies.
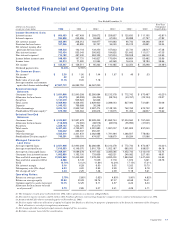
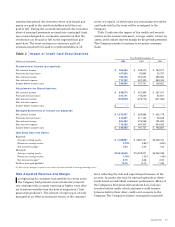
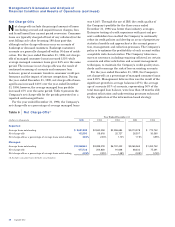
Managed Consumer Loan Portfolio
The Company analyzes its financial performance on a
managed consumer loan portfolio basis. Managed con-
sumer loan data adjusts the balance sheet and income
statement to add back the effect of securitizing consumer
loans. The Company also evaluates its interest rate
exposure on a managed portfolio basis.
The Company’s managed consumer loan portfolio is com-
prised of on-balance sheet loans, loans held for securitiza-
tion and securitized loans. Securitized loans are not
assets of the Company and, therefore, are not shown on the
balance sheet. Reported consumer loans consist of on-balance
sheet loans and loans held for securitization and excludes
securitized loans. Table 1 summarizes the Company’s
managed consumer loan portfolio.
Table 1 Managed Consumer Loan Portfolio
Year Ended December 31
(in thousands) 1996 1995 1994 1993 1992
Year-End Balances:
Consumer loans held for securitization $ 400,000
On-balance sheet consumer loans $ 4,343,902 2,521,679 $2,228,455 $1,862,744 $1,304,560
Securitized consumer loans 8,460,067 7,523,801 5,150,000 2,969,656 680,000
Total managed consumer loan portfolio $12,803,969 $10,445,480 $7,378,455 $4,832,400 $1,984,560
Average Balances:
Consumer loans held for securitization $ 699,044 $ 402,602 $ 432,581 $ 393,835
On-balance sheet consumer loans 2,952,864 2,537,606 1,854,103 1,819,543 $ 772,742
Securitized consumer loans 7,616,553 6,149,070 3,910,739 1,052,187 680,000
Total average managed consumer loan portfolio $11,268,461 $ 9,089,278 $6,197,423 $3,265,565 $1,452,742