Capital One 1996 Annual Report Download - page 32
Download and view the complete annual report
Please find page 32 of the 1996 Capital One annual report below. You can navigate through the pages in the report by either clicking on the pages listed below, or by using the keyword search tool below to find specific information within the annual report.-
 1
1 -
2
-
3
-
4
-
5
-
6
-
7
-
8
-
9
-
10
-
11
-
12
-
13
-
14
-
15
-
16
-
17
-
18
-
19
-
20
-
21
-
 22
22 -
 23
23 -
 24
24 -
 25
25 -
 26
26 -
 27
27 -
 28
28 -
 29
29 -
 30
30 -
 31
31 -
 32
32 -
 33
33 -
 34
34 -
 35
35 -
 36
36 -
 37
37 -
 38
38 -
 39
39 -
 40
40 -
 41
41 -
 42
42 -
43
-
44
-
45
-
46
-
47
-
48
-
49
-
50
-
51
-
52
-
53
-
54
-
55
-
56
-
57
-
58
-
59
 |
 |

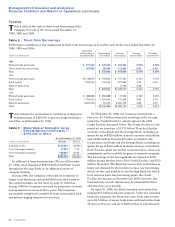
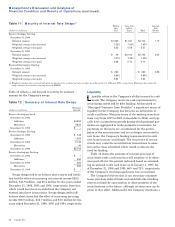
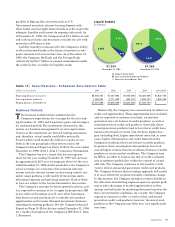
Table 9 shows the maturation of certificates of deposit in
denominations of $100,000 or greater (large denomina-
tion CDs) as of December 31, 1996.
Table 9 M aturities of Domestic Large
Denomination Certificates —
$100,000 or M ore
As of December 31, 1996
(dollars in thousands) Balance Percent
3 months or less $155,961 40.80%
Over 3 through 6 months 27,293 7.14
Over 6 through 12 months 198,981 52.06
Total $382,235 100.00%
In addition to large denomination CDs, as of December
31, 1996, retail deposits of $560.8 million had been raised
through the Savings Bank as an additional source of
company funding.
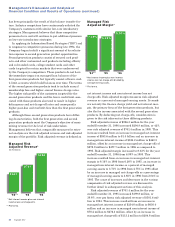
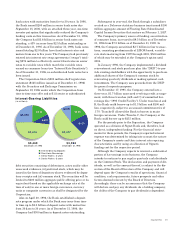
During 1996, the Company continued its transition to
longer-term financing and established increased access to
the capital markets. As the chart on page 31 indicates,
during 1996 the Company increased its proportion of senior
note maturities in excess of three years. The Company
successfully completed a number of large transactions with
maturities ranging from two to ten years.
On November 25, 1996, the Company entered into a
four-year, $1.7 billion unsecured revolving credit arrange-
ment (the “Credit Facility”), which replaced the 1995
Credit Facility, discussed below. The Credit Facility is com-
prised of two tranches: a $1.375 billion Tranche A facility
available to the Bank and the Savings Bank, including an
option for up to $225 million in multi-currency availability,
and a $325 million Tranche B facility available to the
Corporation, the Bank and the Savings Bank, including an
option for up to $100 million in multi-currency availability.
Each Tranche under the facility is structured as a four-year
commitment and is available for general corporate purposes.
The borrowings of the Savings Bank are limited to $500
million during the first year of the Credit Facility, and $750
million thereafter. The Bank has irrevocably undertaken to
honor any demand by the lenders to repay any borrowings
which are due and payable by the Savings Bank but which
have not been paid. Any borrowing under the Credit
Facility will mature on November 24, 2000; however, the
final maturity of each tranche may be extended for three
additional one-year periods.
On April 30, 1996, the Bank amended and restated its
existing $3.5 billion bank note program. Under the amended
bank note program, the Bank may issue from time to time
up to $4.5 billion of senior bank notes with maturities from
30 days to 30 years and up to $200 million of subordinated
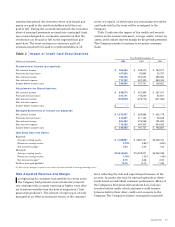
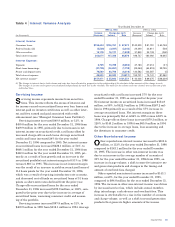
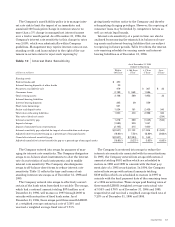
Table 8 Short-Term Borrow ings
Following is a summary of the components of short-term borrowings as of and for each of the years ended December 31,
1996, 1995 and 1994: Maximum
Outstanding at Outstanding Average Average Year-End
(dollars in thousands) Any Month-End at Year-End Outstanding Interest Rate Interest Rate
1996
Federal funds purchased $ 617,303 $ 445,600 $ 342,354 5.63% 6.26%
Other short-term borrowings 207,689 85,383 112,545 8.20 6.43
Total $ 530,983 $ 454,899 6.27% 6.29%
1995
Federal funds purchased $1,146,678 $ 709,803 $ 747,350 6.14% 5.76%
Bank facility 1,000,000 100,000 277,945 7.26 6.03
Affiliate borrowings 2,780 5.86
Total $ 809,803 $1,028,075 6.44% 5.79%
1994
Federal funds purchased $ 686,688 $ 686,688 $ 47,332 6.18% 6.29%
Bank facility 1,700,000 1,300,000 175,342 6.89 6.74
Affiliate borrowings 3,261,506 54,000 2,064,105 3.69 6.00
Total $2,040,688 $2,286,779 4.00% 6.57%
Funding
Table 8 reflects the costs of short-term borrowings of the
Company for each of the years ended December 31,
1996, 1995 and 1994.
Capital One
Management’s Discussion and Analysis of
Financial Condition and Results of Operations (continued)
30