Capital One 1996 Annual Report Download - page 37
Download and view the complete annual report
Please find page 37 of the 1996 Capital One annual report below. You can navigate through the pages in the report by either clicking on the pages listed below, or by using the keyword search tool below to find specific information within the annual report.-
 1
1 -
2
-
3
-
4
-
5
-
6
-
7
-
8
-
9
-
10
-
11
-
12
-
13
-
14
-
15
-
16
-
17
-
18
-
19
-
20
-
21
-
22
-
23
-
24
-
25
-
26
-
 27
27 -
 28
28 -
 29
29 -
 30
30 -
 31
31 -
 32
32 -
 33
33 -
 34
34 -
 35
35 -
 36
36 -
 37
37 -
 38
38 -
 39
39 -
 40
40 -
 41
41 -
 42
42 -
 43
43 -
 44
44 -
 45
45 -
 46
46 -
 47
47 -
48
-
49
-
50
-
51
-
52
-
53
-
54
-
55
-
56
-
57
-
58
-
59
 |
 |

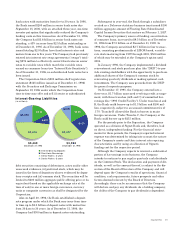
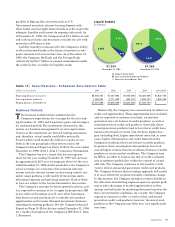
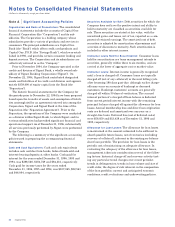
$407
$413
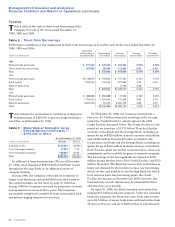
Liquid Assets
(in millions)
$1,285
December 31,1995
$1,394
December 31,1996
$465
$865
$79
$450
■ Federal Funds Sold
■ Cash and Interest-bearing Deposits
■ Securities Available for Sale
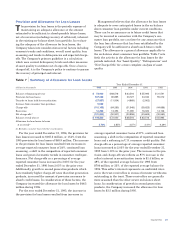
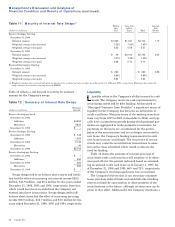
Table 13 Securitizations – Scheduled Amortization Table
(dollars in thousands) 1997 1998 1999 2000 2001-2004
Beginning balance, January 1 $8,460,067 $7,367,986 $4,656,588 $3,824,468 $1,830,764
Less repayment amounts 1,092,081 2,711,398 832,120 1,993,704 1,830,764
Ending balance, December 31 $7,367,986 $4,656,588 $3,824,468 $1,830,764 $ –
Capital One 35
portfolio of high-quality securities such as U.S.
Government securities, interest-bearing deposits with
other banks and overnight federal funds in order to provide
adequate liquidity and to meet its ongoing cash needs. As
of December 31, 1996, the Company had $1.0 billion of cash
and cash equivalents and securities available for sale with
maturities of 90 days or less.
Liability liquidity is measured by the Company’s ability
to obtain borrowed funds in the financial markets in ade-
quate amounts and at favorable rates. As of December 31,
1996, the Company, the Bank and the Savings Bank
collectively had $1.7 billion in unused commitments under
the credit facility available for liquidity needs.
Business Outlook
This business outlook section summarizes the
Company’s expectations for earnings for the year end-
ing December 31, 1997 and its primary goals and strategies
for continued growth. The statements contained in this
section are based on management’s current expectations.
Certain of the statements are forward looking statements
and, therefore, actual results could differ materially.
Factors which could materially influence results are set
forth in the last paragraph of this section and in the
Company’s Annual Report on Form 10-K for the year ended
December 31, 1996 (Part I, Item I, Cautionary Statements).
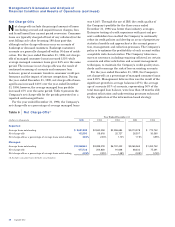
The Company has set a target that its earnings per
share for the year ending December 31, 1997 will increase
by approximately 20% over earnings per share for the year
ended December 31, 1996. As discussed above, the Company’s
actual earnings are a function of its revenues (interest
income and non-interest income on its earning assets), con-
sumer usage patterns, credit quality of its earning assets,
solicitation expenses and operating expenses. Each of these
in turn are subject to the factors discussed in this section.
The Company’s strategy for future growth has been, and
it is expected to continue to be, to apply its proprietary IBS
to its credit card business as well as to other businesses,
both financial and non-financial, to identify new product
opportunities and to make informed investment decisions
regarding its existing products. See the Company’s Annual
Report on Form 10-K for the year ended December 31, 1996
for a further description of the Company’s IBS (Part I, Item
1, Business).
Historically, the Company has concentrated its efforts on
credit card opportunities. These opportunities have included,
and are expected to continue to include, various first
generation low-rate balance transfer products, as well as
second generation credit card products. Generally, these
second generation products tend to have lower credit lines,
balances that build over time, less attrition, higher mar-
gins (including fees), higher operational costs and, in some
cases, higher delinquencies and credit losses than the
Company’s traditional low-rate balance transfer products.
In general, these second generation products have had
overall higher returns than the traditional balance transfer
products in recent market conditions. The Company uses
its IBS in an effort to balance the mix of credit card prod-
ucts to optimize profitability within the context of accept-
able risk. The Company continues to test market a wide
variety of first and second generation credit card products.
The Company believes that its testing approach will enable
it to react effectively as general market conditions change.
In this manner, the Company intends to remain flexible in
the allocation of marketing expenses spent on specific prod-
ucts to take advantage of market opportunities as they
emerge and will make its marketing decisions based on the
then current market conditions. As a result, the Company
expects to continue to offer a variety of first and second
generation credit card products; however, the mix of such
products in the Company’s portfolio may vary significantly
over time.