Capital One 1996 Annual Report Download - page 3
Download and view the complete annual report
Please find page 3 of the 1996 Capital One annual report below. You can navigate through the pages in the report by either clicking on the pages listed below, or by using the keyword search tool below to find specific information within the annual report.-
 1
1 -
 2
2 -
 3
3 -
 4
4 -
 5
5 -
 6
6 -
 7
7 -
 8
8 -
 9
9 -
 10
10 -
 11
11 -
 12
12 -
 13
13 -
 14
14 -
15
-
16
-
17
-
18
-
19
-
20
-
21
-
22
-
23
-
24
-
25
-
26
-
27
-
28
-
29
-
30
-
31
-
32
-
33
-
34
-
35
-
36
-
37
-
38
-
39
-
40
-
41
-
42
-
43
-
44
-
45
-
46
-
47
-
48
-
49
-
50
-
51
-
52
-
53
-
54
-
55
-
56
-
57
-
58
-
59
 |
 |
1
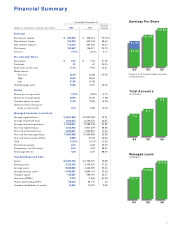
Financial Summary
Year Ended December 31
Percent
(dollars in thousands, except per share data) 1996 1995 Change
Earnings
Net interest income $ 365,484 $ 208,013 75.70)%
Non-interest income 763,424 553,043 38.04
Non-interest expense 713,182 497,430 43.37
Net income 155,267 126,511 22.73
Tax rate 37.5% 36.0% 4.17
Per Common Share
Net income $ 2.30 $ 1.90 21.05
Dividends .32 .24 33.33
Book value at year-end 11.16 9.05 23.31
Market prices
Year-end 36.00 23.88 50.79
High 36.63 29.63
Low 21.88 15.38
Price/Earnings ratio 15.65 12.57 24.50
Ratios
Return on average assets 2.79% 2.85% (2.11)
Return on average equity 22.94 23.28 (1.46)
Common equity to assets 11.45 12.59 (9.05)
Allowance for loan losses to
loans as of year-end 2.73 2.85 (4.21)
Managed Consumer Loan Data
Average reported loans $ 3,651,908 $ 2,940,208 24.21
Average securitized loans 7,616,553 6,149,070 23.87
Average total managed loans 11,268,461 9,089,278 23.98
Year-end reported loans 4,343,902 2,921,679 48.68
Year-end securitized loans 8,460,067 7,523,801 12.44
Year-end total managed loans 12,803,969 10,445,480 22.58
Year-end total accounts (000’s) 8,586 6,149 39.63
Yield 14.76% 13.12% 12.50
Net interest margin 8.16 6.28 29.94
Delinquency rate (30+ days) 6.24 4.20 48.57
Net charge-off rate 4.24 2.25 88.44
Year-End Reported Data
Assets $ 6,467,445 $ 4,759,321 35.89
Earning assets 5,702,005 4,155,475 37.22
Average assets 5,568,960 4,436,055 25.54
Average earning assets 4,798,987 3,890,131 23.36
Common equity 740,391 599,191 23.57
Associates (FTEs) 5,740 3,559 61.28
Shares outstanding (000’s) 66,325 66,175 .23
Common stockholders of record 14,562 13,247 9.93
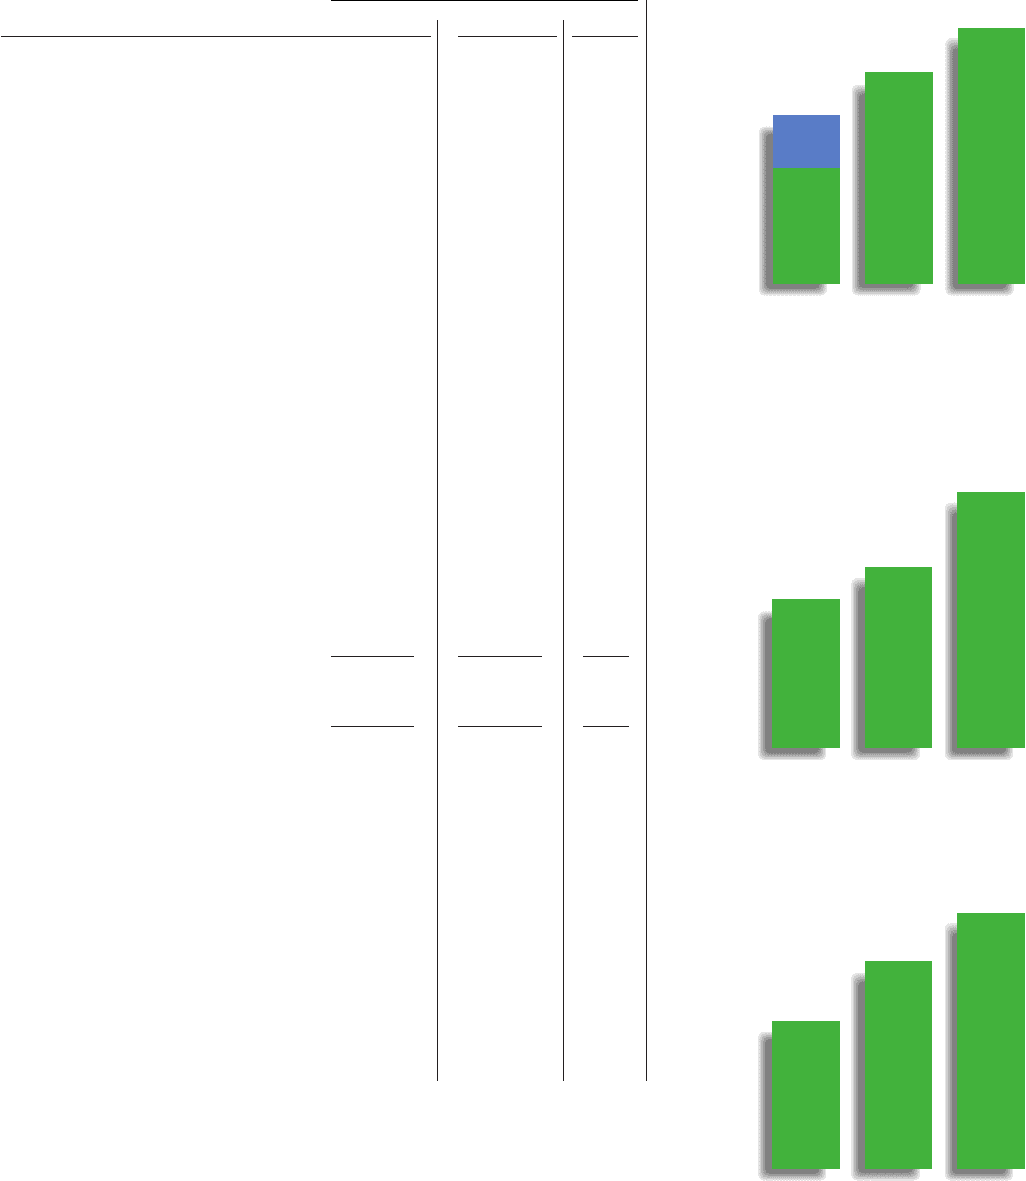
‘94*
Earnings Per Share
‘95 ‘96
*Pro forma. $1.52 includes $.48 per share effect
of separation costs.
$1.52
$1.04
$1.90
$2.30
‘94
Total Accounts
(in millions)
‘95 ‘96
5.0
6.1
8.6
‘94
Managed Loans
(in billions)
‘95 ‘96
$7.4
$10.4
$12.8