Capital One 1996 Annual Report Download - page 30
Download and view the complete annual report
Please find page 30 of the 1996 Capital One annual report below. You can navigate through the pages in the report by either clicking on the pages listed below, or by using the keyword search tool below to find specific information within the annual report.-
 1
1 -
2
-
3
-
4
-
5
-
6
-
7
-
8
-
9
-
10
-
11
-
12
-
13
-
14
-
15
-
16
-
17
-
18
-
19
-
 20
20 -
 21
21 -
 22
22 -
 23
23 -
 24
24 -
 25
25 -
 26
26 -
 27
27 -
 28
28 -
 29
29 -
 30
30 -
 31
31 -
 32
32 -
 33
33 -
 34
34 -
 35
35 -
 36
36 -
 37
37 -
 38
38 -
 39
39 -
 40
40 -
41
-
42
-
43
-
44
-
45
-
46
-
47
-
48
-
49
-
50
-
51
-
52
-
53
-
54
-
55
-
56
-
57
-
58
-
59
 |
 |

Capital One
Management’s Discussion and Analysis of
Financial Condition and Results of Operations (continued)
28
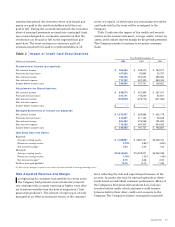
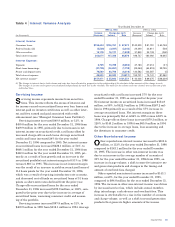
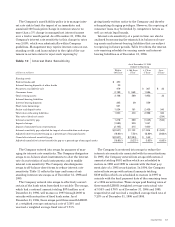
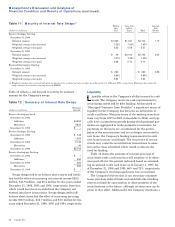
Table 6 Net Charge-Offs(1)
Year Ended December 31
(dollars in thousands) 1996 1995 1994 1993 1992
Reported:
Average loans outstanding $ 3,651,908 $2,940,208 $2,286,684 $2,213,378 $ 772,742
Net charge-offs 132,590 59,618 25,727 26,307 30,560
Net charge-offs as a percentage of average loans outstanding 3.63% 2.03% 1.13% 1.19% 3.95%
Managed:
Average loans outstanding $11,268,461 $9,089,278 $6,197,423 $3,265,565 $1,452,742
Net charge-offs 477,732 204,828 91,648 68,332 75,291
Net charge-offs as a percentage of average loans outstanding 4.24% 2.25% 1.48% 2.09% 5.18%
(1) Includes consumer loans held for securitization.
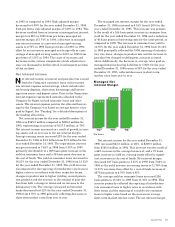
Net Charge-Offs
Net charge-offs include the principal amount of losses
(excluding accrued and unpaid finance charges, fees
and fraud losses) less current period recoveries. Consumer
loans are typically charged off (net of any collateral) in the
next billing cycle after becoming 180 days past-due,
although earlier charge-offs may occur on accounts of
bankrupt or deceased customers. Bankrupt customers’
accounts are generally charged off within 30 days of notifi-
cation. For the year ended December 31, 1996, net charge-
offs of managed consumer loans increased 133% while
average managed consumer loans grew 24% over the same
period. The increase in net charge-offs was the result of
continued seasoning of accounts and consumer loan
balances, general economic trends in consumer credit per-
formance and the impact of intense competition. During
the year ended December 31, 1995, net charge-offs of man-
aged loans increased 123% over the year ended December
31, 1994; however, the average managed loan portfolio
increased 47% over the same period. Table 6 presents the
Company’s net charge-offs for the periods presented on a
reported and managed basis.
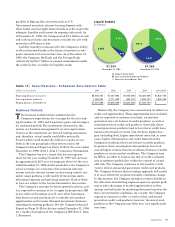
For the year ended December 31, 1996, the Company’s
net charge-offs as a percentage of average managed loans
was 4.24%. Through the use of IBS, the credit quality of
the Company’s portfolio for the three years ended
December 31, 1996 was better than industry averages.
Extensive testing of credit experience with past and pre-
sent cardholders has enabled the Company to continually
refine its credit policies and develop an array of proprietary
statistical models and approaches to the account genera-
tion, management and collection processes. The Company’s
policy is to optimize the profitability of each account within
acceptable risk characteristics. The Company takes mea-
sures as necessary, including requiring collateral on certain
accounts and other solicitation and account management
techniques, to maintain the Company’s credit quality stan-
dards and to manage the risk of loss on existing accounts.
For the year ended December 31, 1995, the Company’s
net charge-offs as a percentage of managed consumer loans
was 2.25%. Management believes this was the result of the
significant growth in average balances (47%), the average
age of accounts (51% of accounts, representing 50% of the
total managed loan balance, were less than 18 months old),
prudent solicitation and underwriting processes enhanced
by the application of the information-based strategy.