Berkshire Hathaway 2002 Annual Report Download - page 8
Download and view the complete annual report
Please find page 8 of the 2002 Berkshire Hathaway annual report below. You can navigate through the pages in the report by either clicking on the pages listed below, or by using the keyword search tool below to find specific information within the annual report.-
 1
1 -
 2
2 -
 3
3 -
 4
4 -
 5
5 -
 6
6 -
 7
7 -
 8
8 -
 9
9 -
 10
10 -
 11
11 -
 12
12 -
 13
13 -
 14
14 -
 15
15 -
 16
16 -
 17
17 -
 18
18 -
 19
19 -
20
-
21
-
22
-
23
-
24
-
25
-
26
-
27
-
28
-
29
-
30
-
31
-
32
-
33
-
34
-
35
-
36
-
37
-
38
-
39
-
40
-
41
-
42
-
43
-
44
-
45
-
46
-
47
-
48
-
49
-
50
-
51
-
52
-
53
-
54
-
55
-
56
-
57
-
58
-
59
-
60
-
61
-
62
-
63
-
64
-
65
-
66
-
67
-
68
-
69
-
70
-
71
-
72
-
73
-
74
-
75
-
76
-
77
-
78
 |
 |

7
The Economics of Property/Casualty Insurance
Our core business — though we have others of great importance — is insurance. To understand
Berkshire, therefore, it is necessary that you understand how to evaluate an insurance company. The key
determinants are: (1) the amount of float that the business generates; (2) its cost; and (3) most critical of all,
the long-term outlook for both of these factors.
To begin with, float is money we hold but don't own. In an insurance operation, float arises
because premiums are received before losses are paid, an interval that sometimes extends over many years.
During that time, the insurer invests the money. This pleasant activity typically carries with it a downside:
The premiums that an insurer takes in usually do not cover the losses and expenses it eventually must pay.
That leaves it running an “underwriting loss,” which is the cost of float. An insurance business has value if
its cost of float over time is less than the cost the company would otherwise incur to obtain funds. But the
business is a lemon if its cost of float is higher than market rates for money. Moreover, the downward
trend of interest rates in recent years has transformed underwriting losses that formerly were tolerable into
burdens that move insurance businesses deeply into the lemon category.
Historically, Berkshire has obtained its float at a very low cost. Indeed, our cost has been less than
zero in many years; that is, we’ ve actually been paid for holding other people’ s money. In 2001, however,
our cost was terrible, coming in at 12.8%, about half of which was attributable to World Trade Center
losses. Back in 1983-84, we had years that were even worse. There’ s nothing automatic about cheap float.
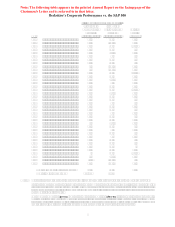
The table that follows shows (at intervals) the float generated by the various segments of
Berkshire’ s insurance operations since we entered the business 36 years ago upon acquiring National
Indemnity Company (whose traditional lines are included in the segment “Other Primary”). For the table
we have calculated our float — which we generate in large amounts relative to our premium volume — by
adding net loss reserves, loss adjustment reserves, funds held under reinsurance assumed and unearned
premium reserves, and then subtracting insurance-related receivables, prepaid acquisition costs, prepaid
taxes and deferred charges applicable to assumed reinsurance. (Got that?)
Yearend Float (in $ millions)
Other Other
Year GEICO General Re Reinsurance Primary Total
1967 20 20
1977 40 131 171
1987 701 807 1,508
1997 2,917 4,014 455 7,386
1998 3,125 14,909 4,305 415 22,754
1999 3,444 15,166 6,285 403 25,298
2000 3,943 15,525 7,805 598 27,871
2001 4,251 19,310 11,262 685 35,508
2002 4,678 22,207 13,396 943 41,224
Last year our cost of float was 1%. As I mentioned earlier, you should temper your enthusiasm
about this favorable result given that no megacatastrophe occurred in 2002. We’ re certain to get one of
these disasters periodically, and when we do our float-cost will spike.